Apps
This page contains an explanation of availibity of apps in Lizard!
Dashboards
Manage, control and keep track with Lizard Dashboards. Lizard Dashboards can offer key insights that help decision makers make data driven decisions. Alarms can be configured to detect anomalies and inform stakeholders via SMS or e-mail to take action.
You find an overview of your dashboards on the My Dashboards page that can be reached via {yourportal}.lizard.net/dashboards. You can give the dashboards a description that will be visualized on the My Dashboards page. You can also tag your Dashboards using #.
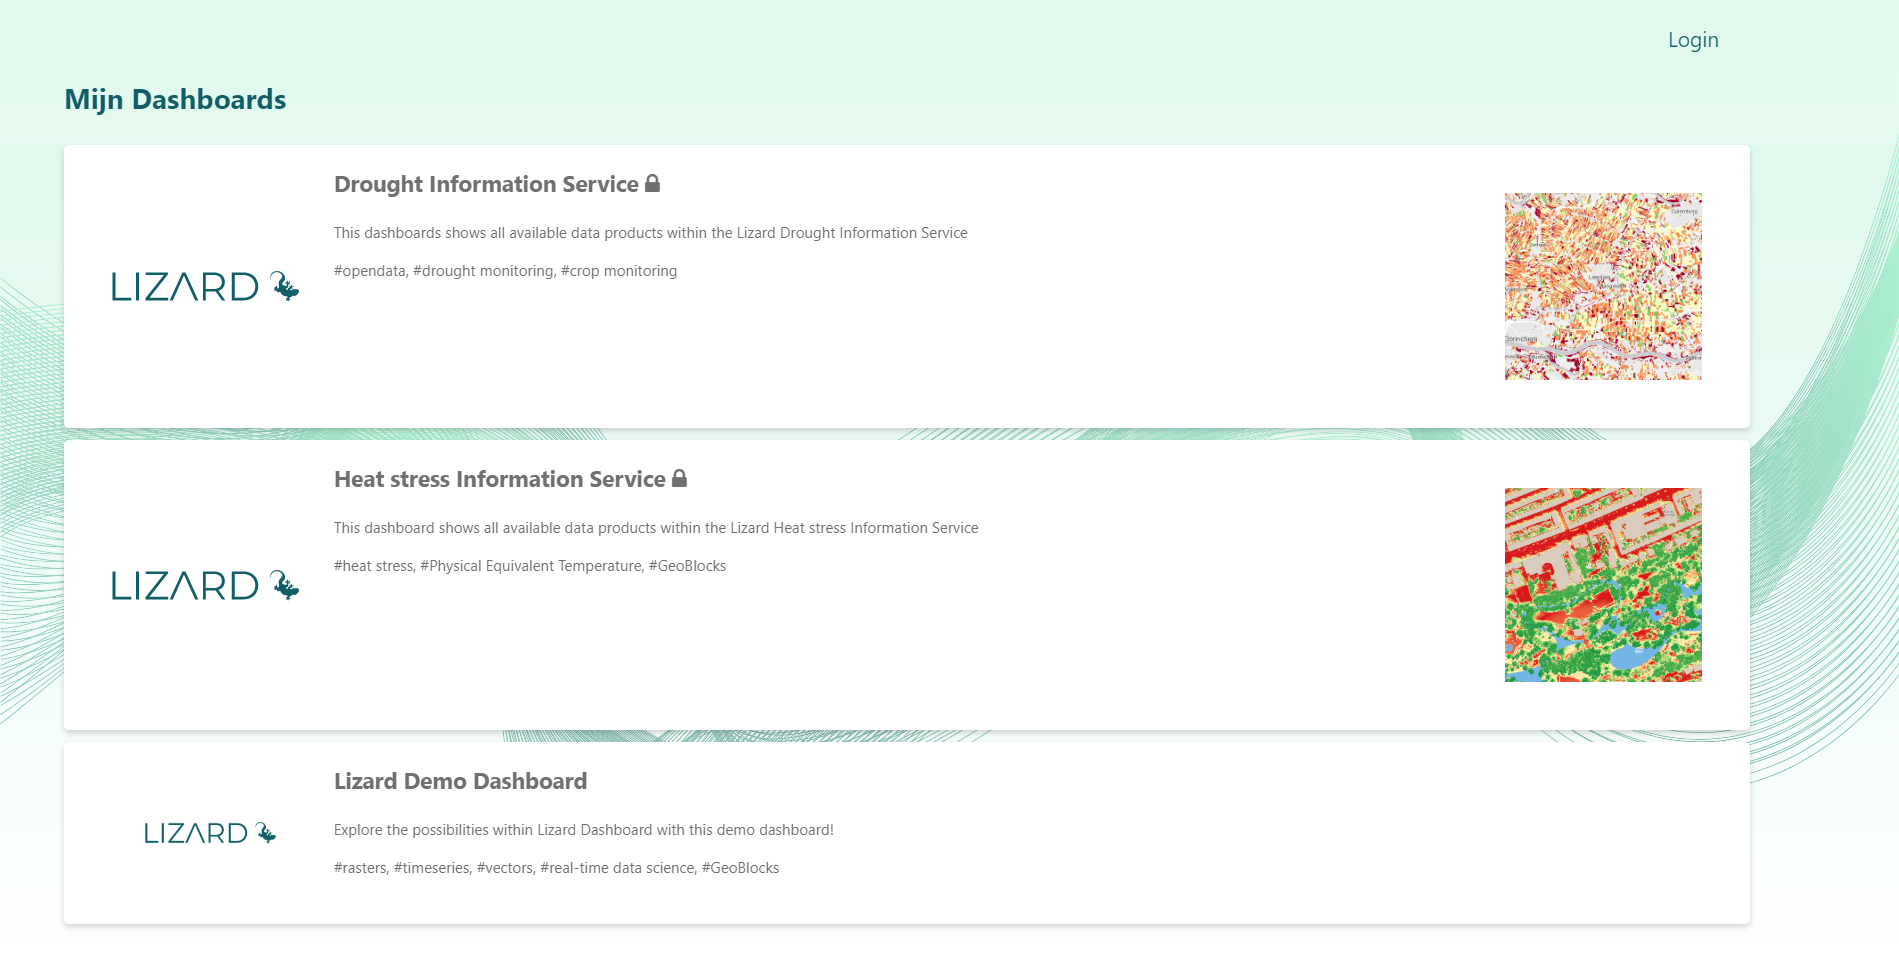
Make sure to login via the  in the upper right corner.
No Lizard Dashboards yet? Contact us via info@lizard.net to learn more about the possibilities of Lizard Dashboards for your organisation. For now you can use the Demo Dashboard to explore the possibilities yourselve.
The Demo Dashboard can be reached via: https://demo.lizard.net/dashboards/
Click on Lizard Demo Dashboard to continue to the dashboard.
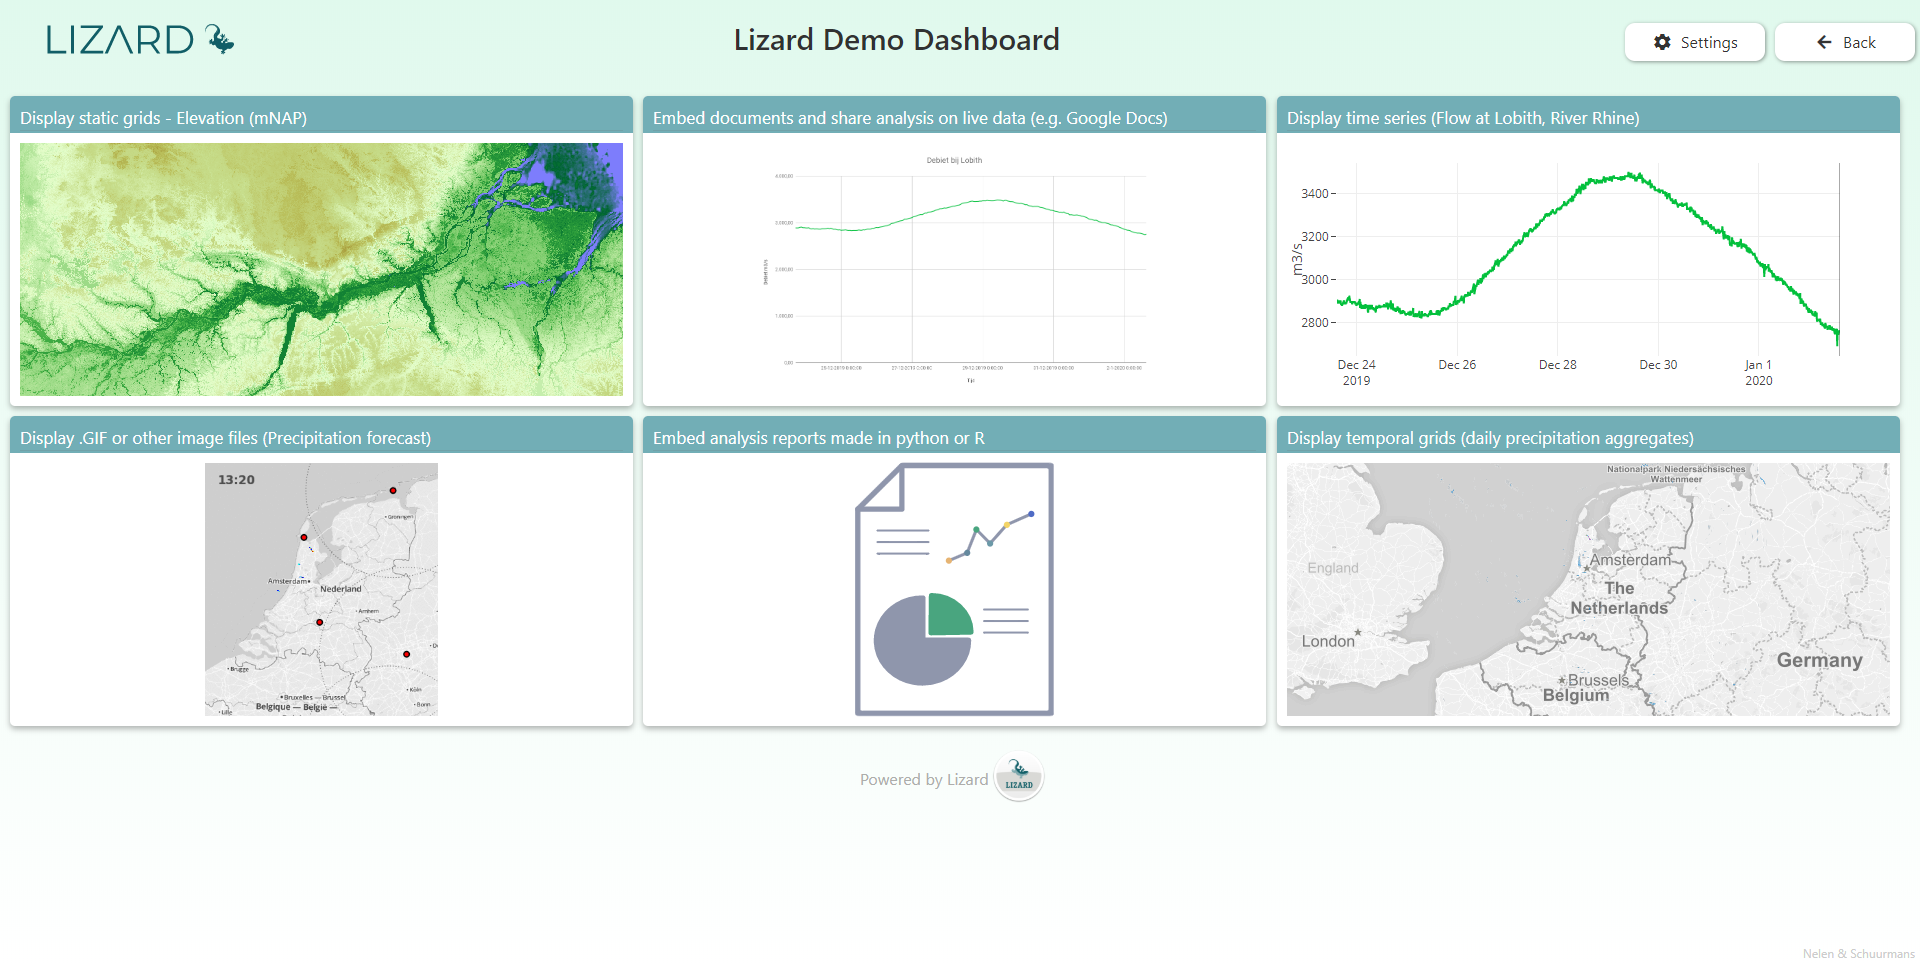
You’re able to visualize the logo of your organisation in the upper left corner of the Dashboard to give it a more personal look and feel. Furthermore you’re able to change the colors & size of the dashboard tiles. Important tiles can be more prominent than others.
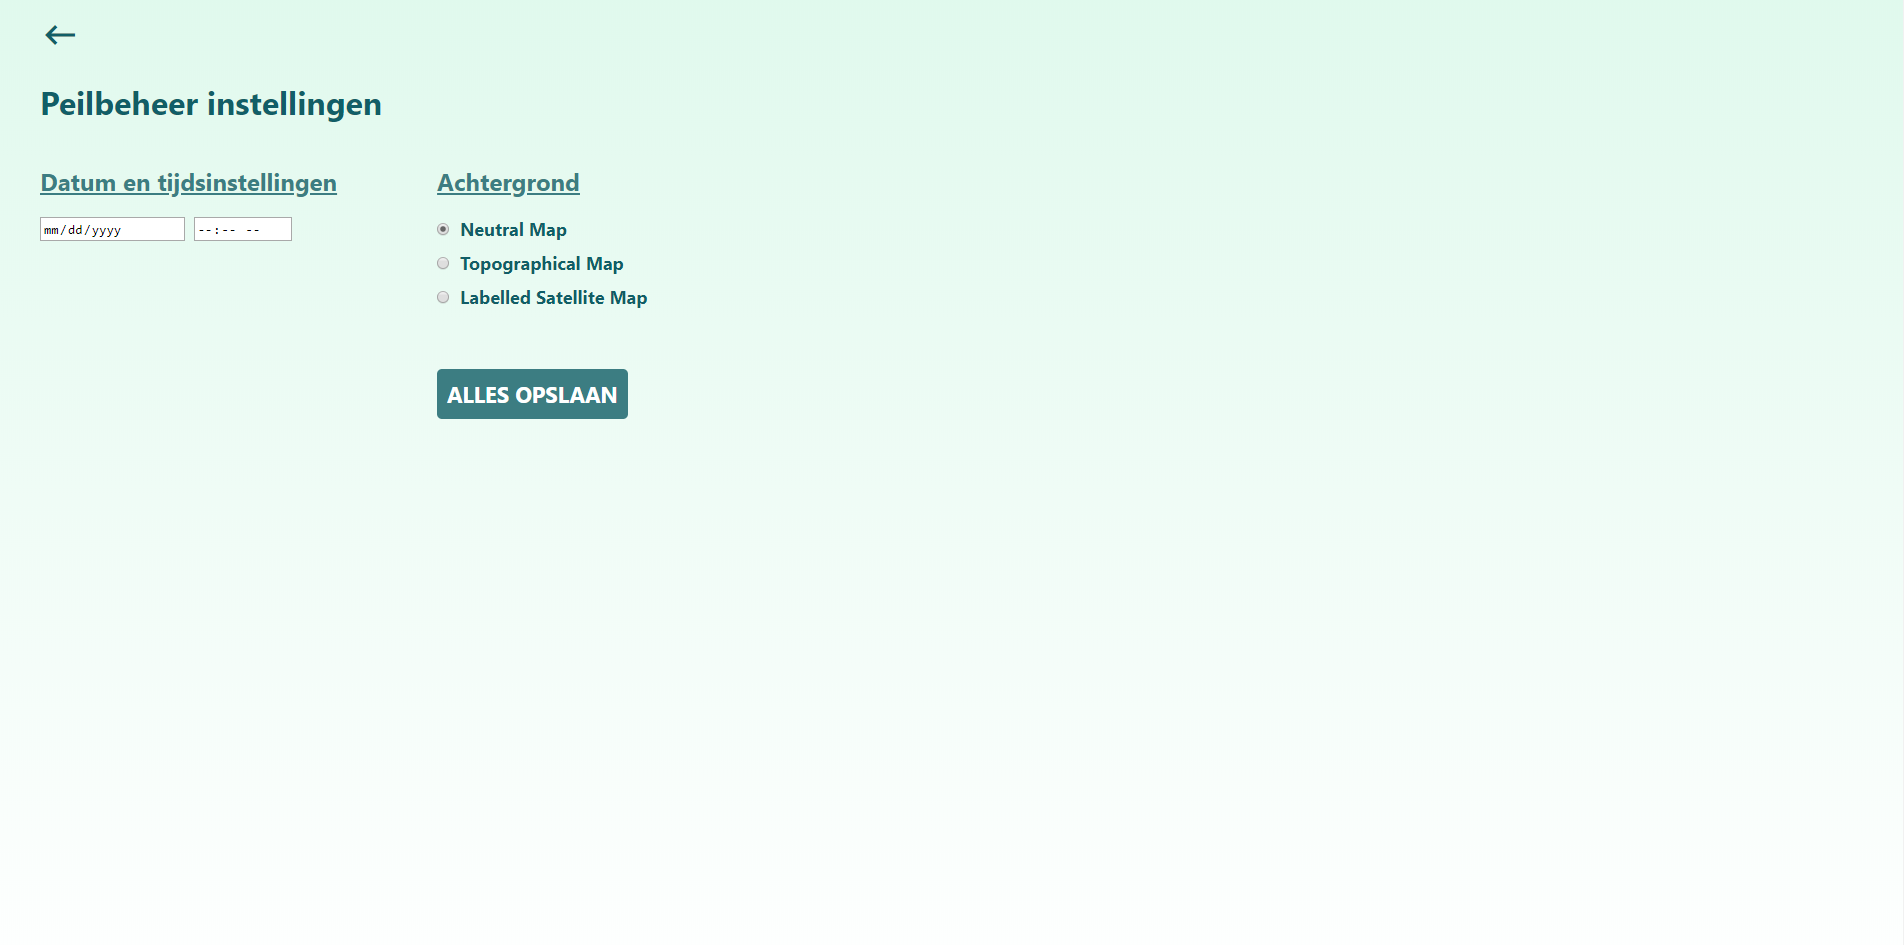
Via the  button you can change the settings of your dashboard.
You can change the date-time settings or switch background layers
button you can change the settings of your dashboard.
You can change the date-time settings or switch background layers
There are several data types that can be visualized in a tile:
Static or temporal rasters
GeoBlocks results
Time series
Vectors
HTML reports
Embedded websites
You can click on a tile to open the tile in full-screen mode. In full screen mode you can also access the legends of the information shown in the map tiles.