Catalogue
General
The Lizard Catalogue offers insight in all data available to your organisation.
You can reach the Catalogue via the following url:
https://demo.lizard.net/catalogue/ or [yourorganisation].lizard.net/catalogue/
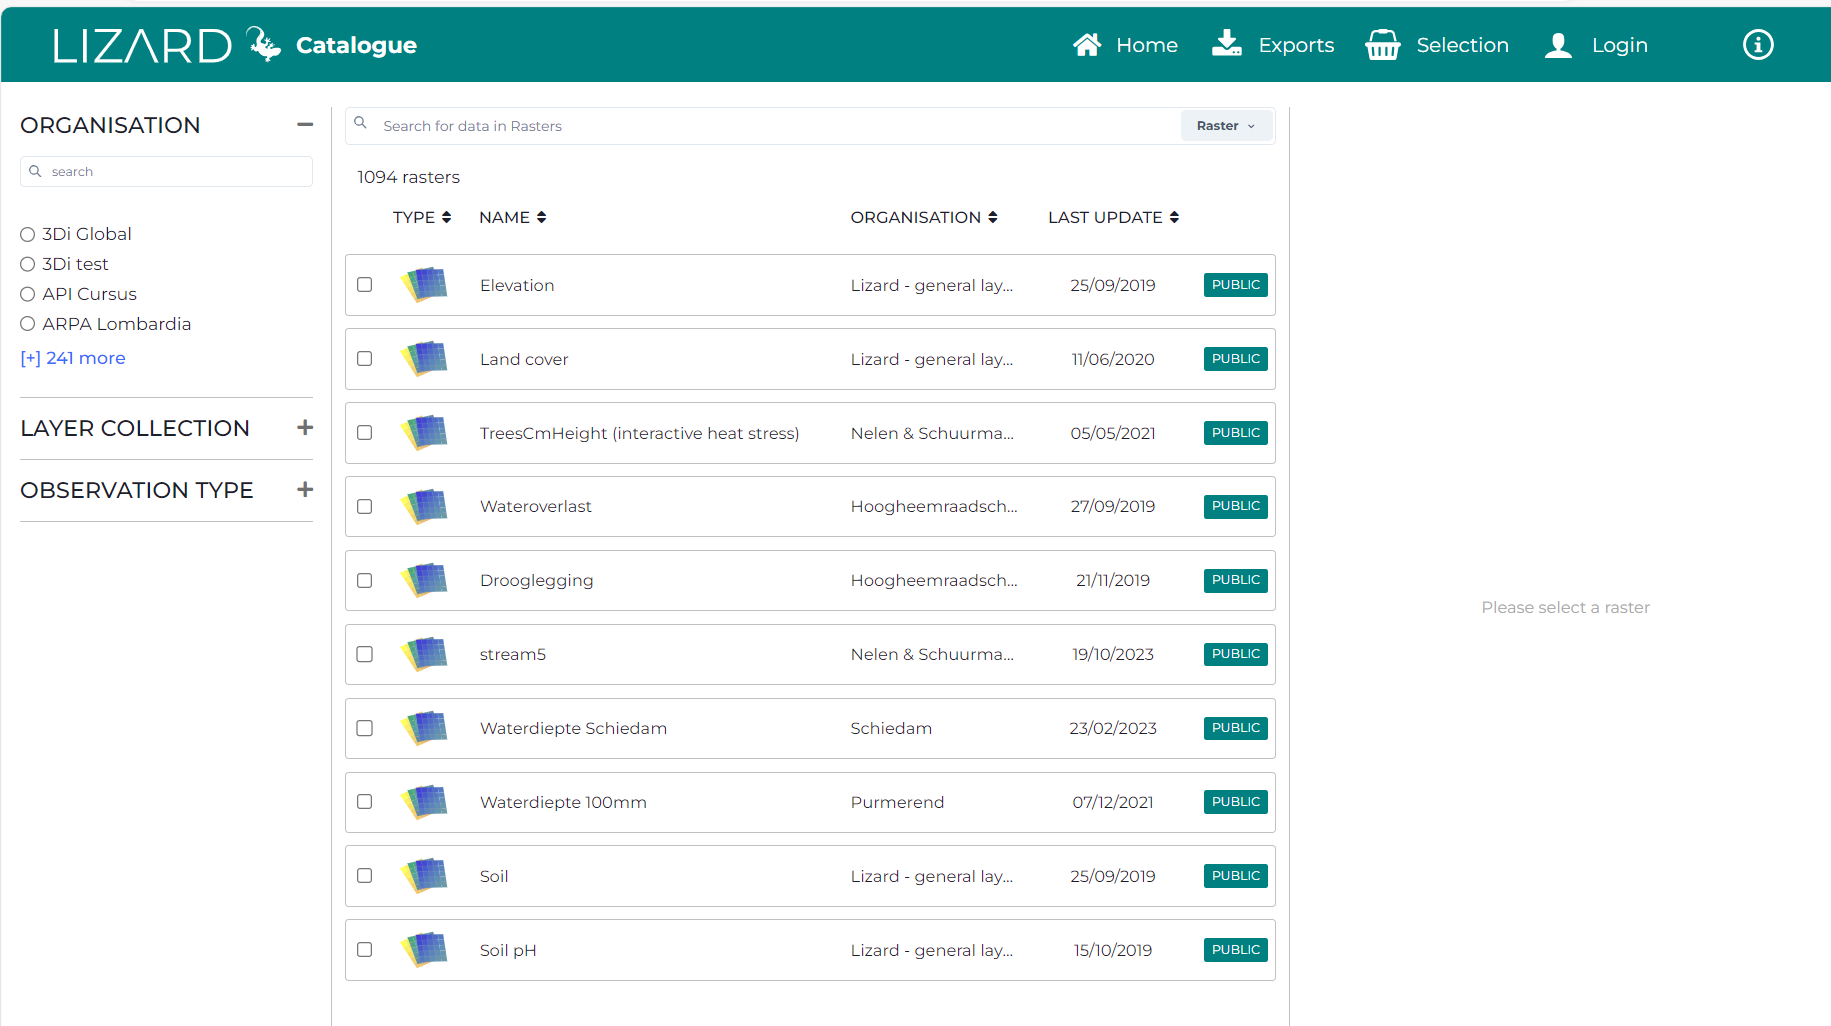
Complete overview of the Lizard catalogue landing page.
For now, the Catalogue covers these four datatypes:
Raster: Raster layers in Lizard (not included are rasters from 3Di scenarios).
WMS layer: Wms layers in Lizard.
Time series: Time series and monitoring networks.
Scenarios: Scenario information from 3Di.
Because of the extensive amount of data available, it is important to be able to search and filter properly. Lizard has a variety of methods to find and group data.
Filters
On the left side of the Catalogue interface you can find several ways of filtering the data layers you have access to. There are three different options:
Organisation: the organisation that owns the data.
Layer Collection: the layer grouping, which can be created and assigned in the management screens.
Observation type: speaks for itself, but the type of data found within the datasource.
Per filter there is a list of all possible options. Only one selection can be made: if you want to filter on Observation type = ‘Waterheight’ you are unable to also include Observation type = ‘Rain’
You can also use the search bar to directly find your data. It is important to select the correct data type.
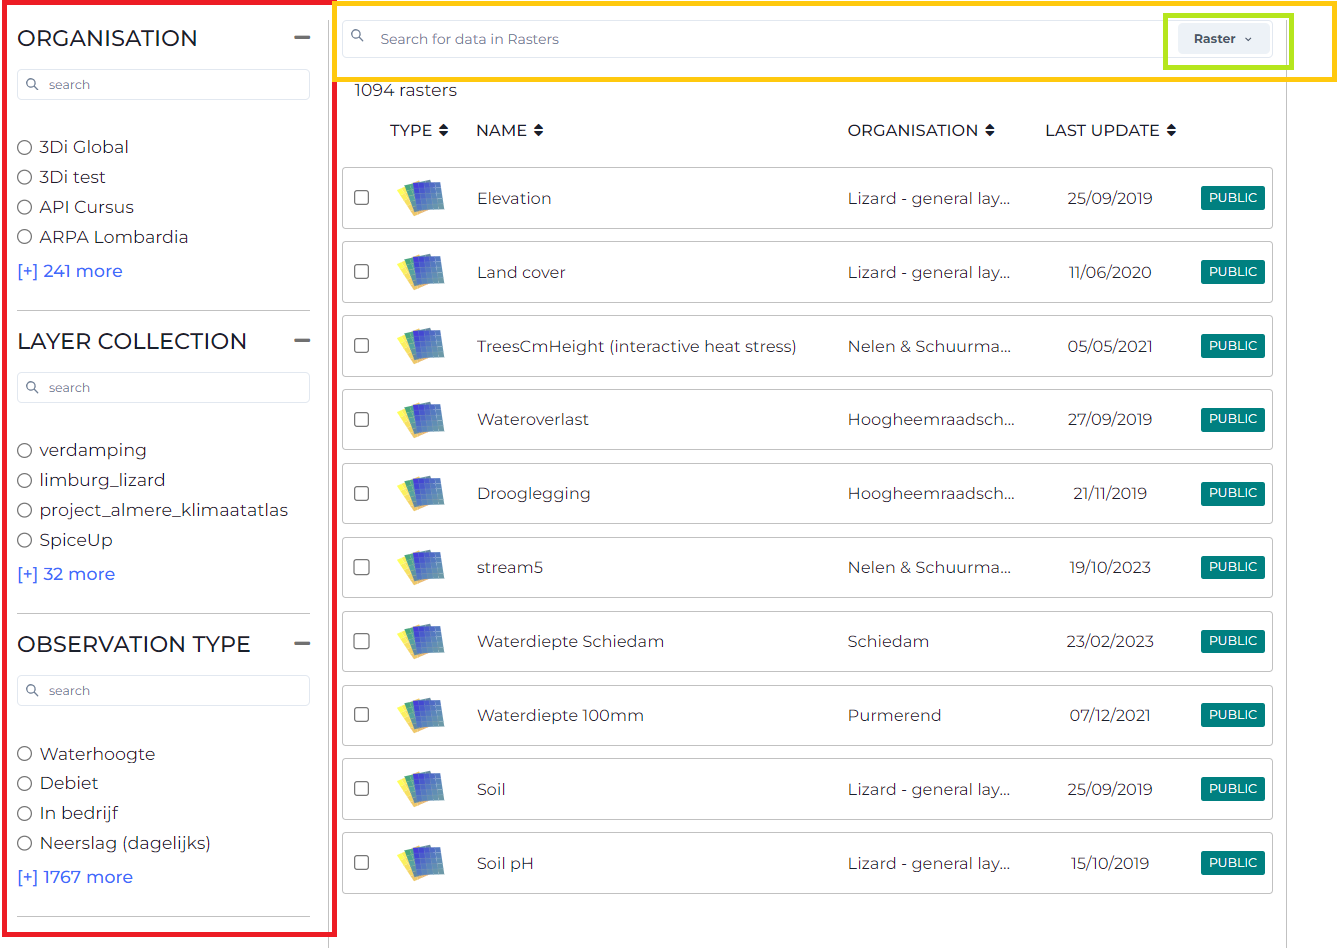
Red, the filtering options on the left panel; Orange, the searchbar; Green, the search datatype.
Export, selection and login
In the top-right corner you will find five different pressable buttons:
Home: return to the homepage of the lizard portal.
Exports: interface of all exports within the session.
Selection: allows you to collect a selection of data within your “cart” to display in the viewer.
Login: log in to the application.
Info: information pop-up with a link to the docs.

Export
Within the export interface you are able to see all current and previous exports within this session. You are able to download the rasters whenever the export is completed. Once you have downloaded your raster of interest, you can clear the task.
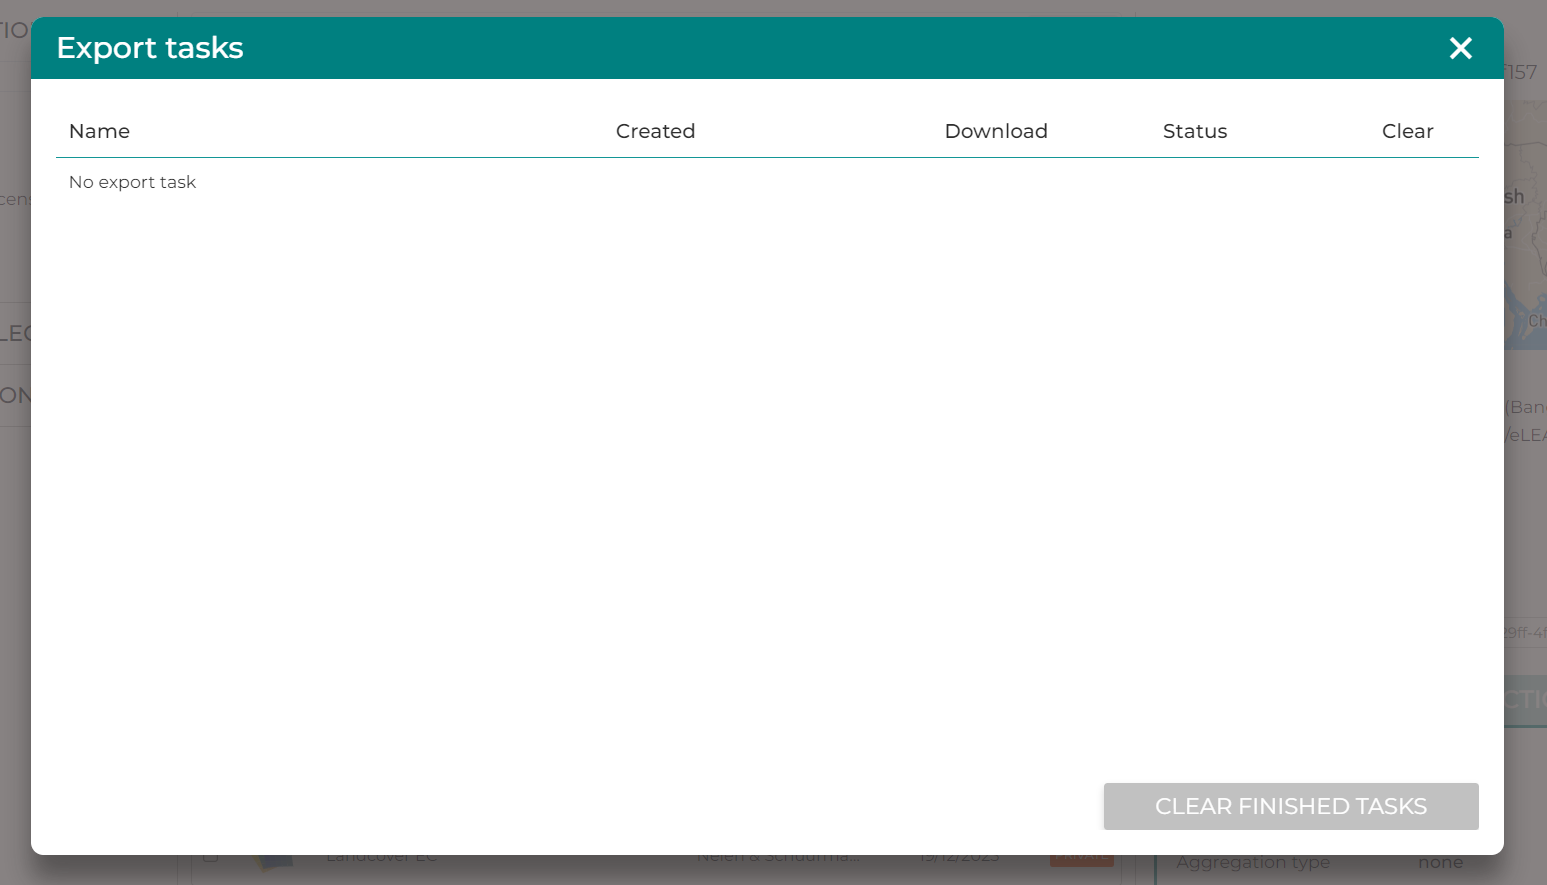
Export tasks, when no exports have yet been completed.
Basket
The Lizard catalogue can be used to quickly access your rasters of interest. One quick way to collect these rasters is through the basket - easily recognized by by the basket icon named Selection. By clicking the checkbox on the left side of a raster you unlock the option to add the raster to your basket. To add multiple layers add once, simply select multiple layers before pressing ADD TO SELECTION. Once you added the rasters to your selection, you will see that the Basket icon now shows the number of selected data layers. Opening the basket gives an overview of all selected layers, and a button to ‘Open all data in Lizard’. This will open a new window for Lizard, with all the collected data layers visible.
Login
Some information is publicly accessible in Lizard. All users which are logged in will have access to ‘common’ data. Depending on the rights of an user a selection of private information will be available. Furthermore, you have to be logged in to be able to export raster data.
Rasters
The default view of the catalogue will display a selection of 10 rasters, with the option to click through to other pages. The following information is visible in this overview, for rasters.
Type: The type of data. A normal raster, or a temporal raster.
Name: Name of the data layer.
Organisation: To which organisation the data layer belongs.
Description: A short description of the data contained within the data layer.
Latest update: When the data layer was last updated.
Access modifier: Divided into Public, Common and Private.
Note
Information about the different access modifiers can be found under organisation modifiers.
Note
Not included are rasters from 3Di scenarios, these are covered under the “Scenarios” date-type.
Raster Information
Once you have selected a raster, the details become available in the right panel. This panel offers a map of the region of interest (base map) and projects the data on top. Underneath some general details are displayed, namely the discription, organisation and the WMS GetCapabilities URL. In the bottom of the right-panel the DETAILS and ACTIONS can be found.
If you want to visualise the layer in your Viewer or if you want to use it for data science purposes you can either choose to open it in the Viewer or the API.
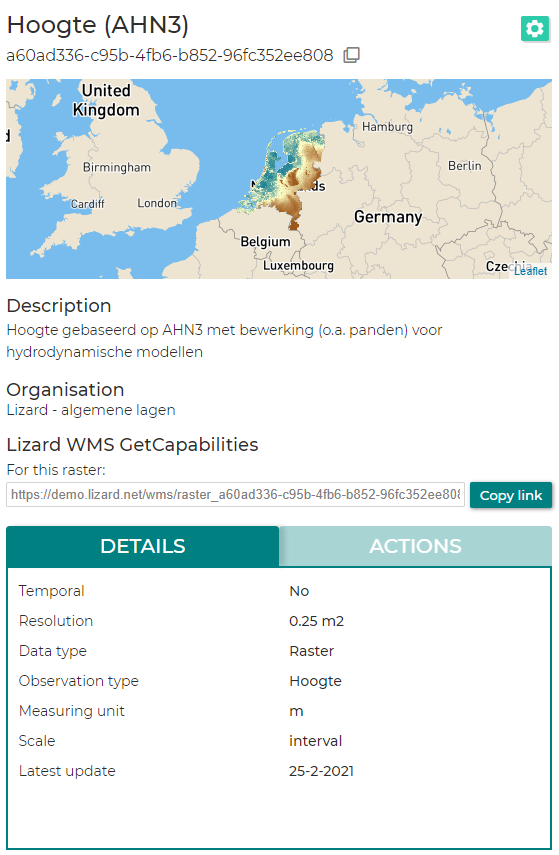
The complete right-panel in the Lizard Catalogue. Presenting a map, description and various details regarding the selected raster (or other data-type).
Lizard WMS Service for rasters
When you filtered on “Layer Collection” a Lizard WMS GetCapabilities link appears in the list of meta data of the raster. You can use this link to visualise the raster in external applications such as QGIS or ESRI applications.
Tip
We now also have a Lizard Plugin for QGIS and the 3Di Modellers Interface that allows you to display WMS-Layers within these applications more easily. You only have to generate an API key to be able to use this plugin. Don’t know how to generate an API key? No problem, go to: API Key.
Note
For more infomation, please consult the WMS Services.
Exporting
Files can be exported from the catalogue. The steps you have to take to download related files depends on the date-type. It is possible to download: rasters, timeseries or files related to scenario’s. To download a raster: (1) select your raster of interest, (2) go to the actions menu in the bottom-right, (3) press Export raster to open the raster export modal.
The raster export modal allows you to select cells for your download. Cell settings can be defined on the right-side of the modal.
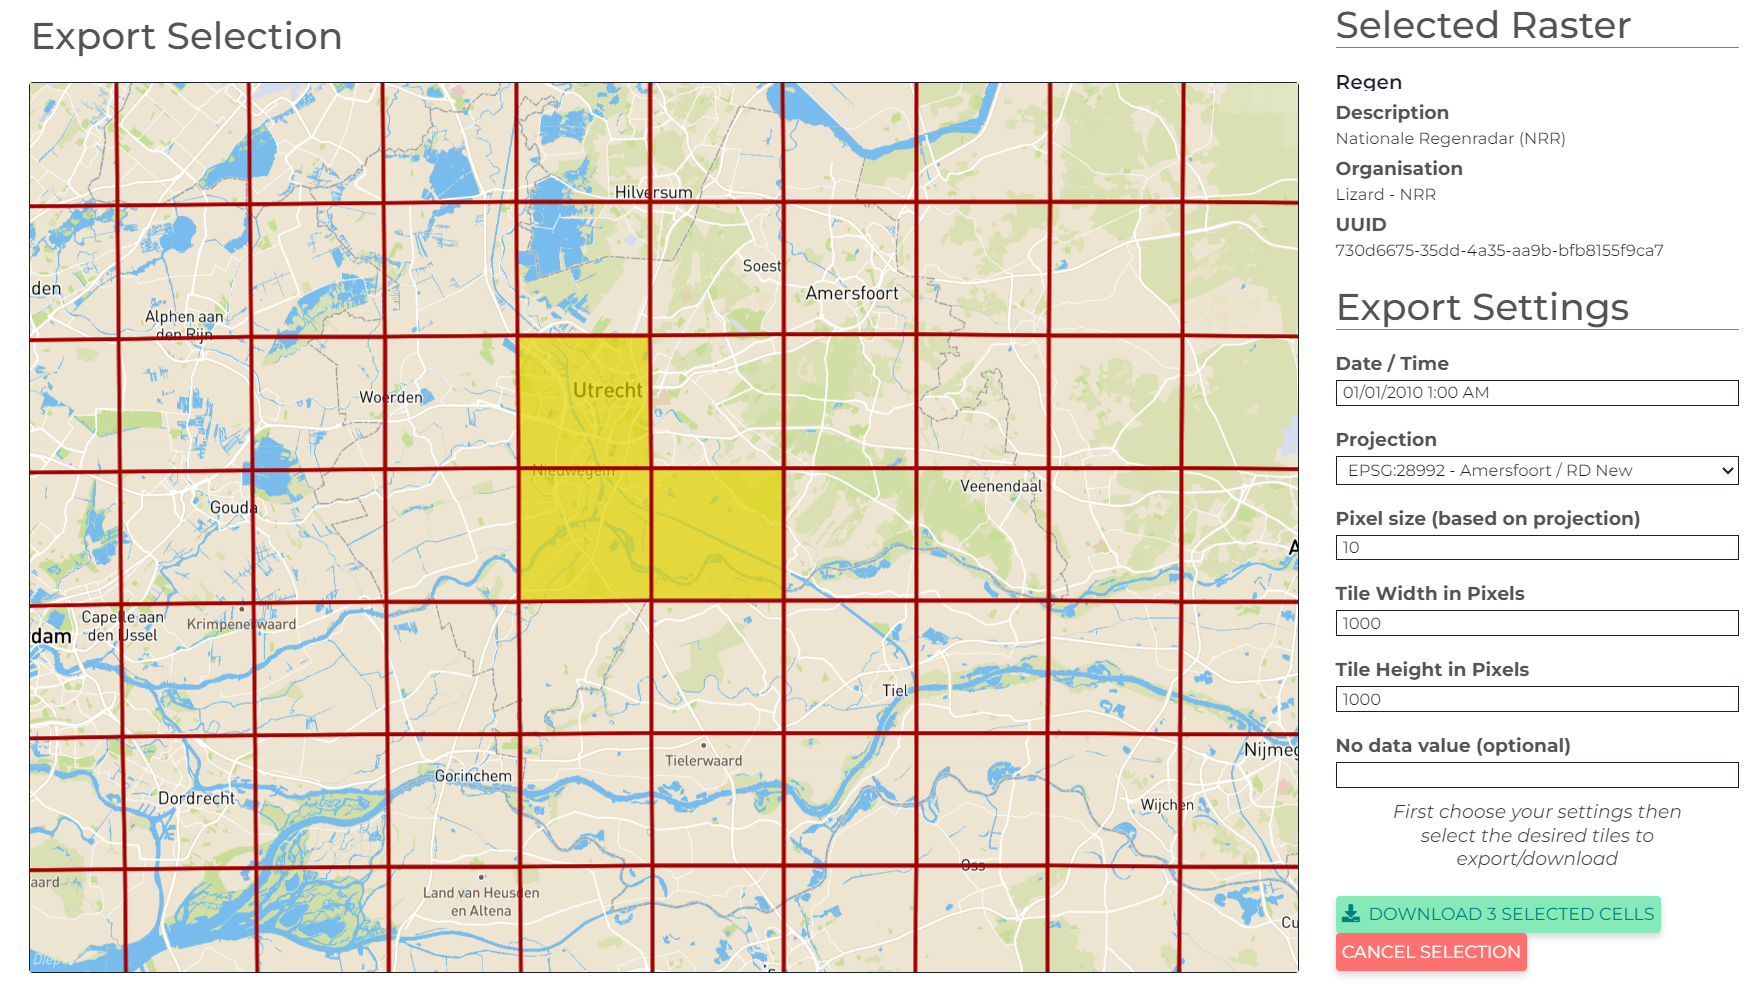
An overview of the export modal.
The Export Selection window will pop up. Follow the steps: - Choose a preferred projection of the output GeoTIFF. - Choose the pixel size (resolution) of the output GeoTIFF. - Choose a preferred tile size.
Tip
Do not use a really small pixel-size when you have a wide-zoom. This will require many grid-cells to be loaded, which comes at a high computational load.
You can export multiple tiles at once, resulting in a series of download tasks. Once your GeoTIFF’s are ready you will receive a notification in the Exports button in the green topbar. If any export tasks have been started a small circle on top op the export-icon will show the number of tiffs that are being (or have been) exported.
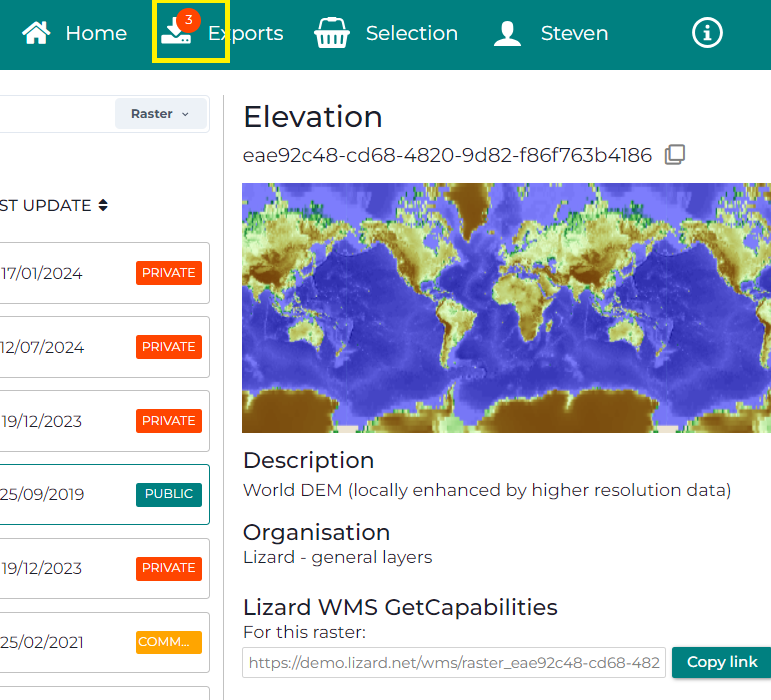
Currently 3 tiffs have been, or are being, downloaded.
WMS layers
The Catalogue allows you to easily filter and visualize WMS-Layers. To start, select WMS as data-type within the search-bar.
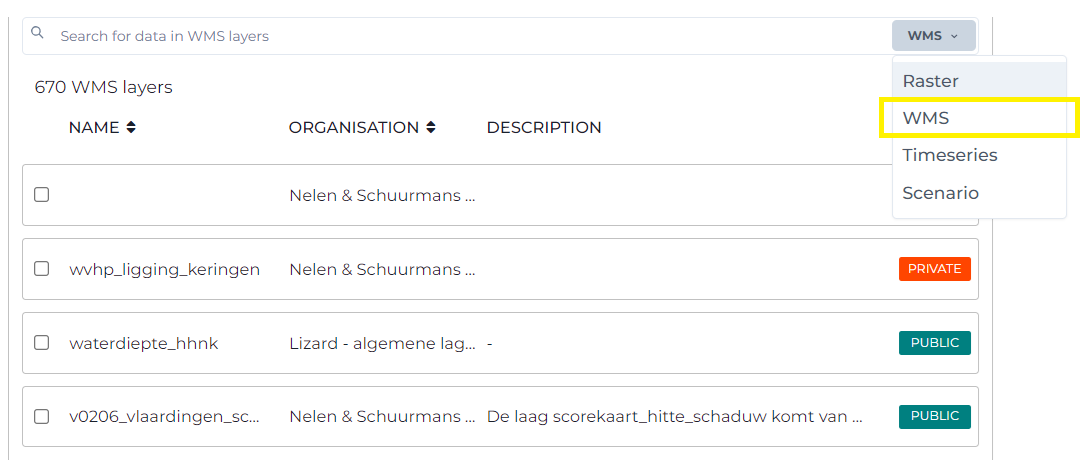
It will show a list of 10 items, with the option to click through to other pages. You are only able to search based on the name in the search bar, however, it is possible to filter based on organisation (left-panel).
The following information is visible in this overview:
Name Name of the wms layer.
Organisation To which organisation the data layer belongs.
Description A short description of the data contained within the data layer.
Access modifier Divided into Public, Common and Private.
Note
Information about the different access modifiers can be found under organisation modifiers.
Details
The details of a WMS-layer are similar to that of a raster. They can be found in the right-panel. The only change is the download functionality, which replaces the export of rasters.
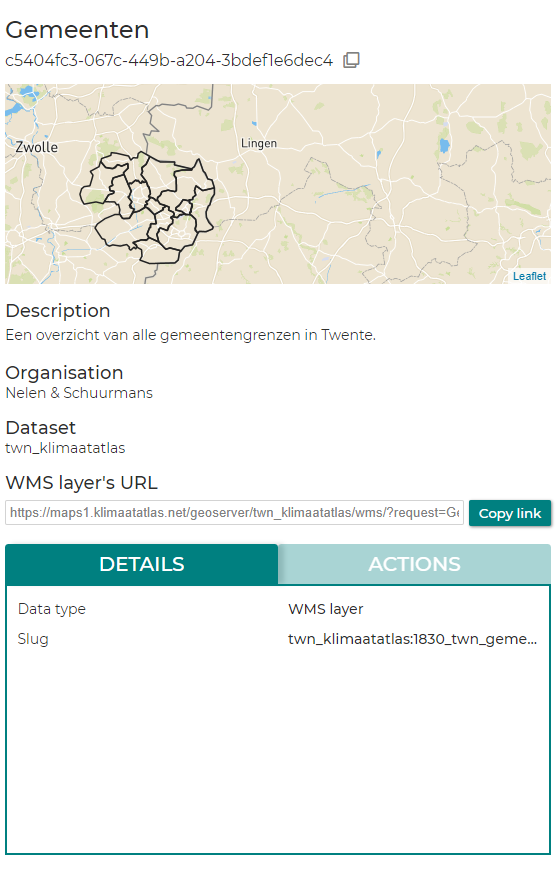
Example of a WMS-layer details panel.
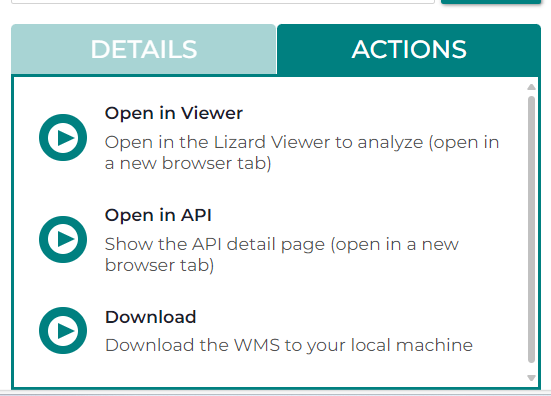
The actions overview within the details panel.
You can download the wms directly, open it in the Viewer or in the API or analyse the wms layer in another application linking to Lizard. You can use this link to visualise the raster in external applications such as QGIS or ESRI applications.
For more infomation, please consult the WMS Services.
Time series and monitoring networks
Like the WMS-Layers, you first have to select the Timeseries date-type. You will then be presented with available monitoring networks. A monitoring network is a group of locations, with one or multiple timeseries. An example of a monitoring network is the dutch meteorological measurements of the KNMI weatherstations. In monitoring networks, you can group locations. These locations can have one, or multiple, timeseries.
The following information is visible in this overview.
Monitoring network Name of the network.
Organisation The organisation to which the monitoring network belongs.
Access modifier Divided into Public, Common and Private.
Note
Information about the different access modifiers can be found under organisation modifiers.
Note
New monitoring networks can be added via https://demo.lizard.net/api/v4/monitoringnetworks/ or {yourorganisation}.lizard.net/api/v4/monitoringnetworks/ or with the help of a consultant. In the near future, time series can be managed via the management screens.
Details
Once you have selected a monitoring network, the map within the right-panel will display all locations within the network. You will find the description right below, and the observation types of the timeseries can be found in the details tab.
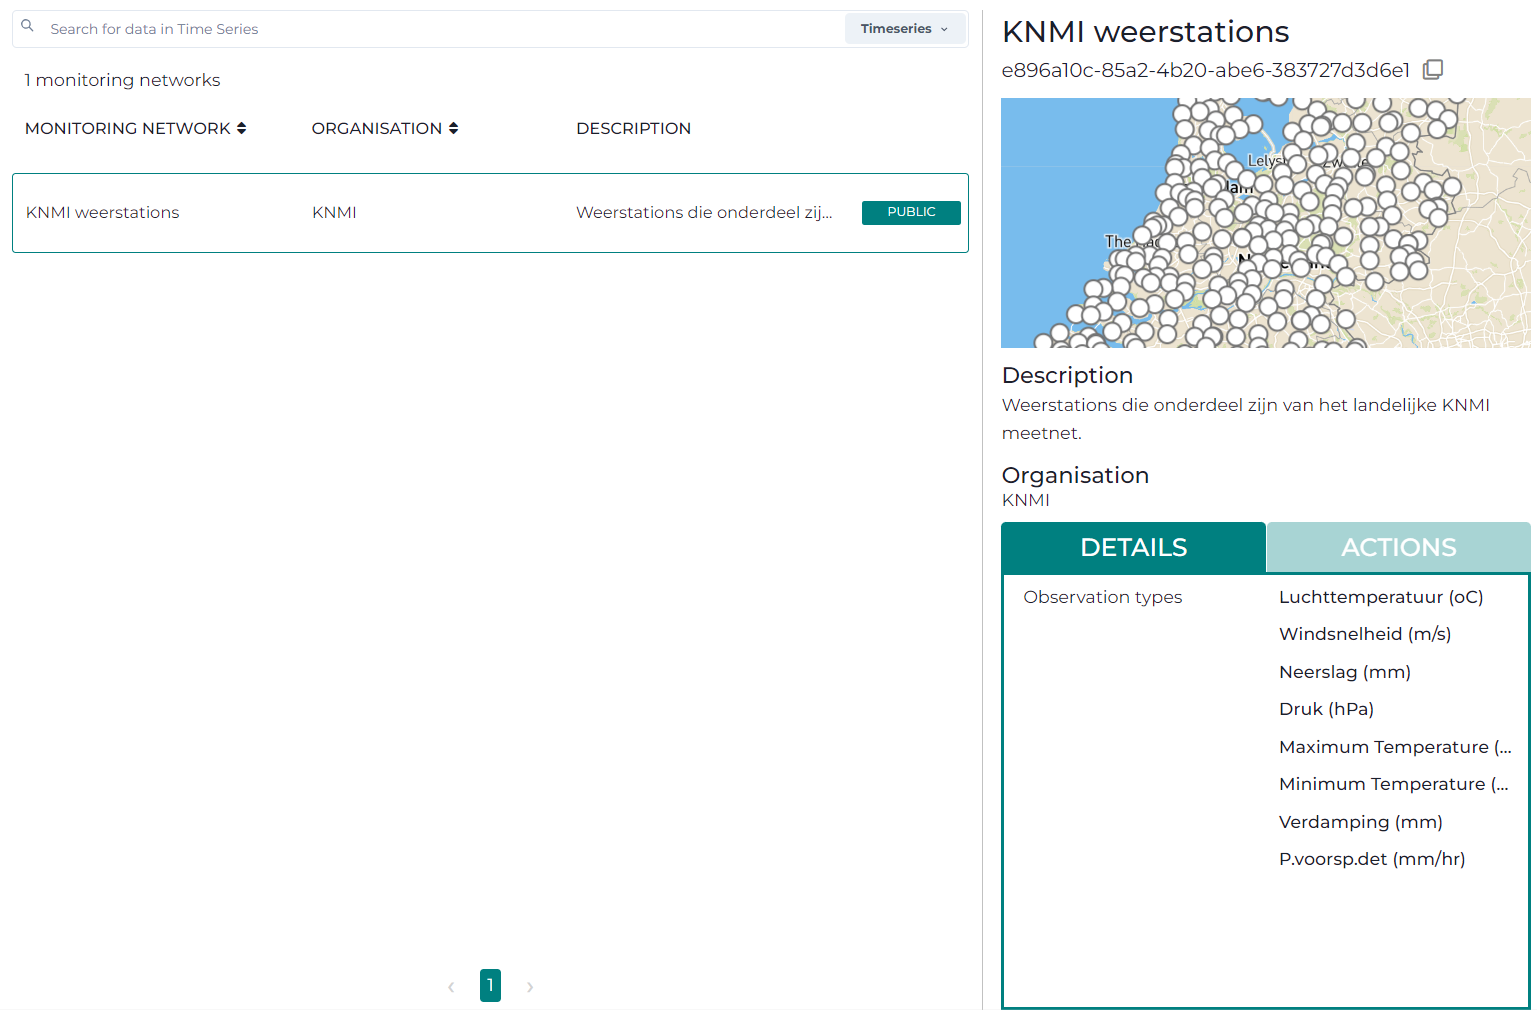
An overview of the KNMI weatherstations monitoring network.
Action menu
In the action menu, you can export the timeries you are interested in or open it in the Viewer or in the API. You can filter on the observation type or on the availability of data in a certain period and/or on location.
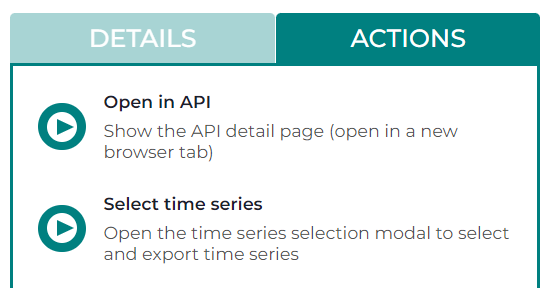
Monitoring networks have two actions, view the details within the API, or select a timeseries of interest.
First choose Select time series.
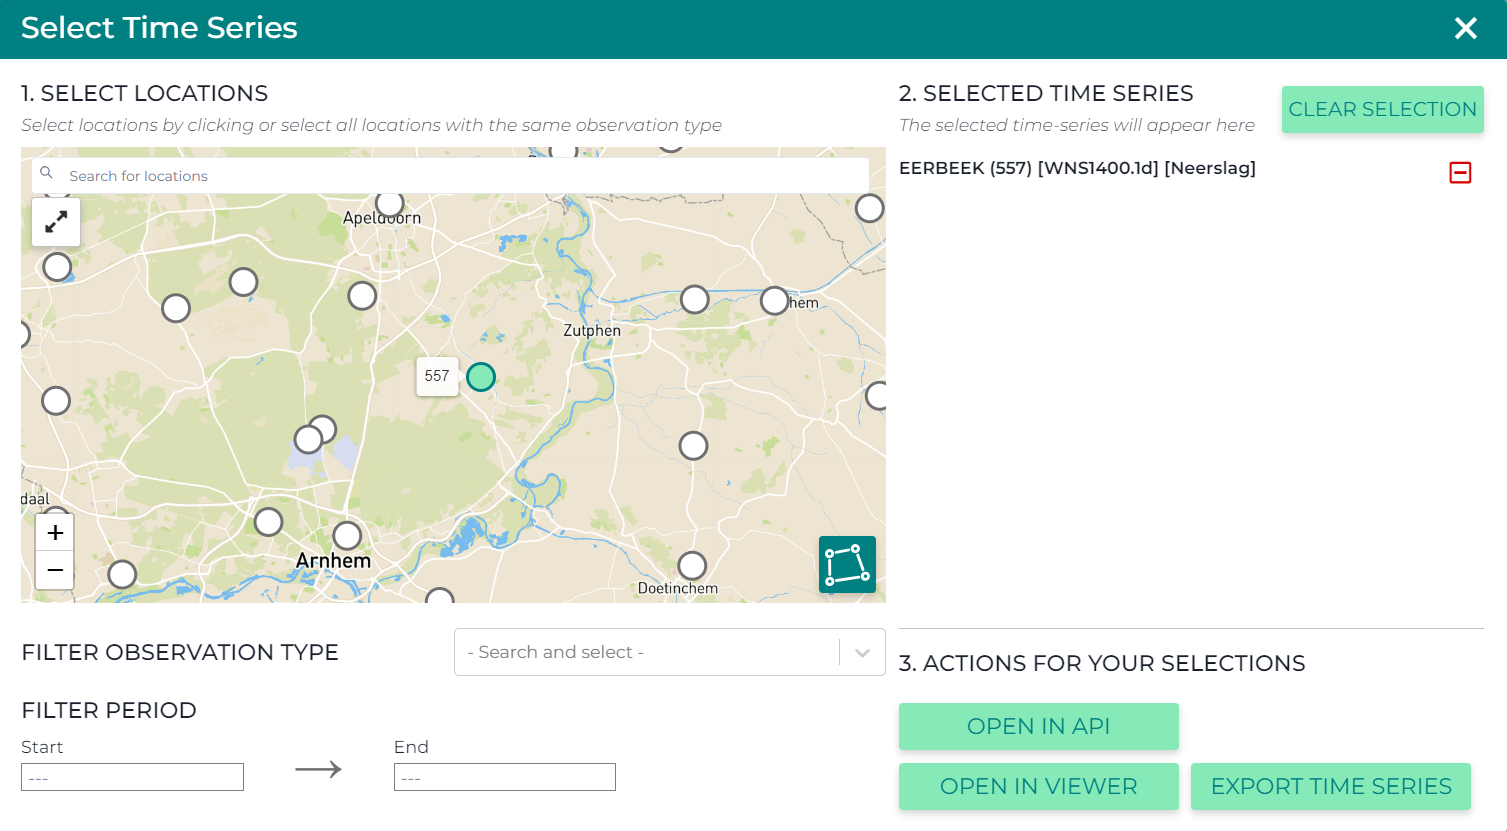
The select time series button will open the timeseries selection modality.
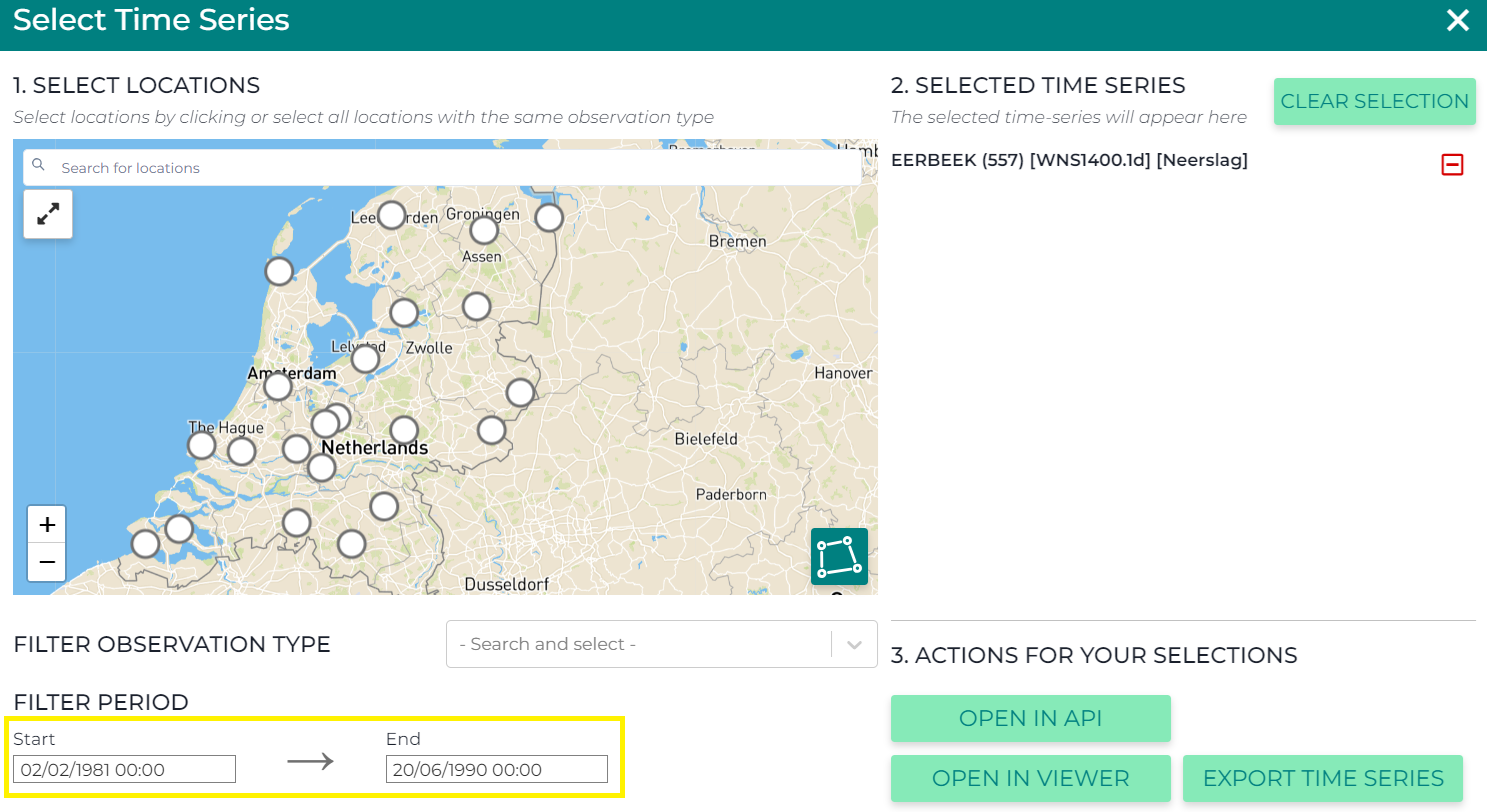
If you provide a timeframe, only locations where data is available will be shown.
Scenarios
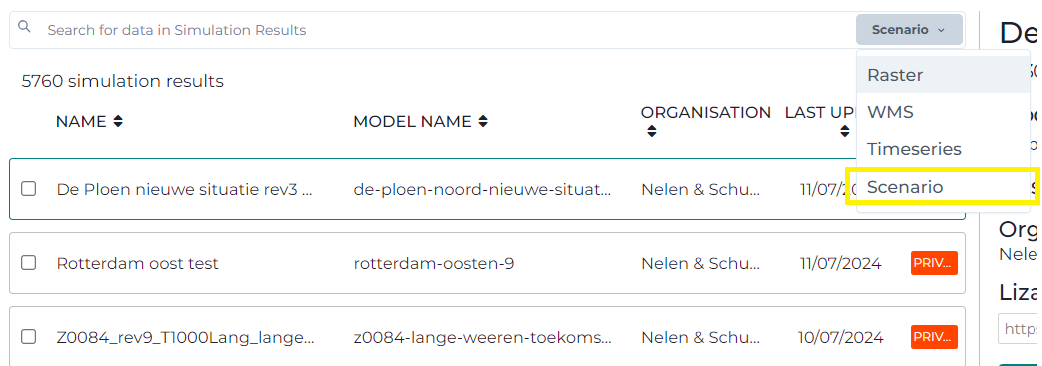
To find information in regards to the 3Di scenarios, that have been exported to Lizard, the first step is to select the Scenario date-type.
The following information is visible in this overview.
Name Name of the data layer.
Model name Name of the model the scenario is based on.
Organisation To which organisation the data layer belongs.
Last update When the data layer was last updated.
Access modifier Divided into Public, Common and Private.
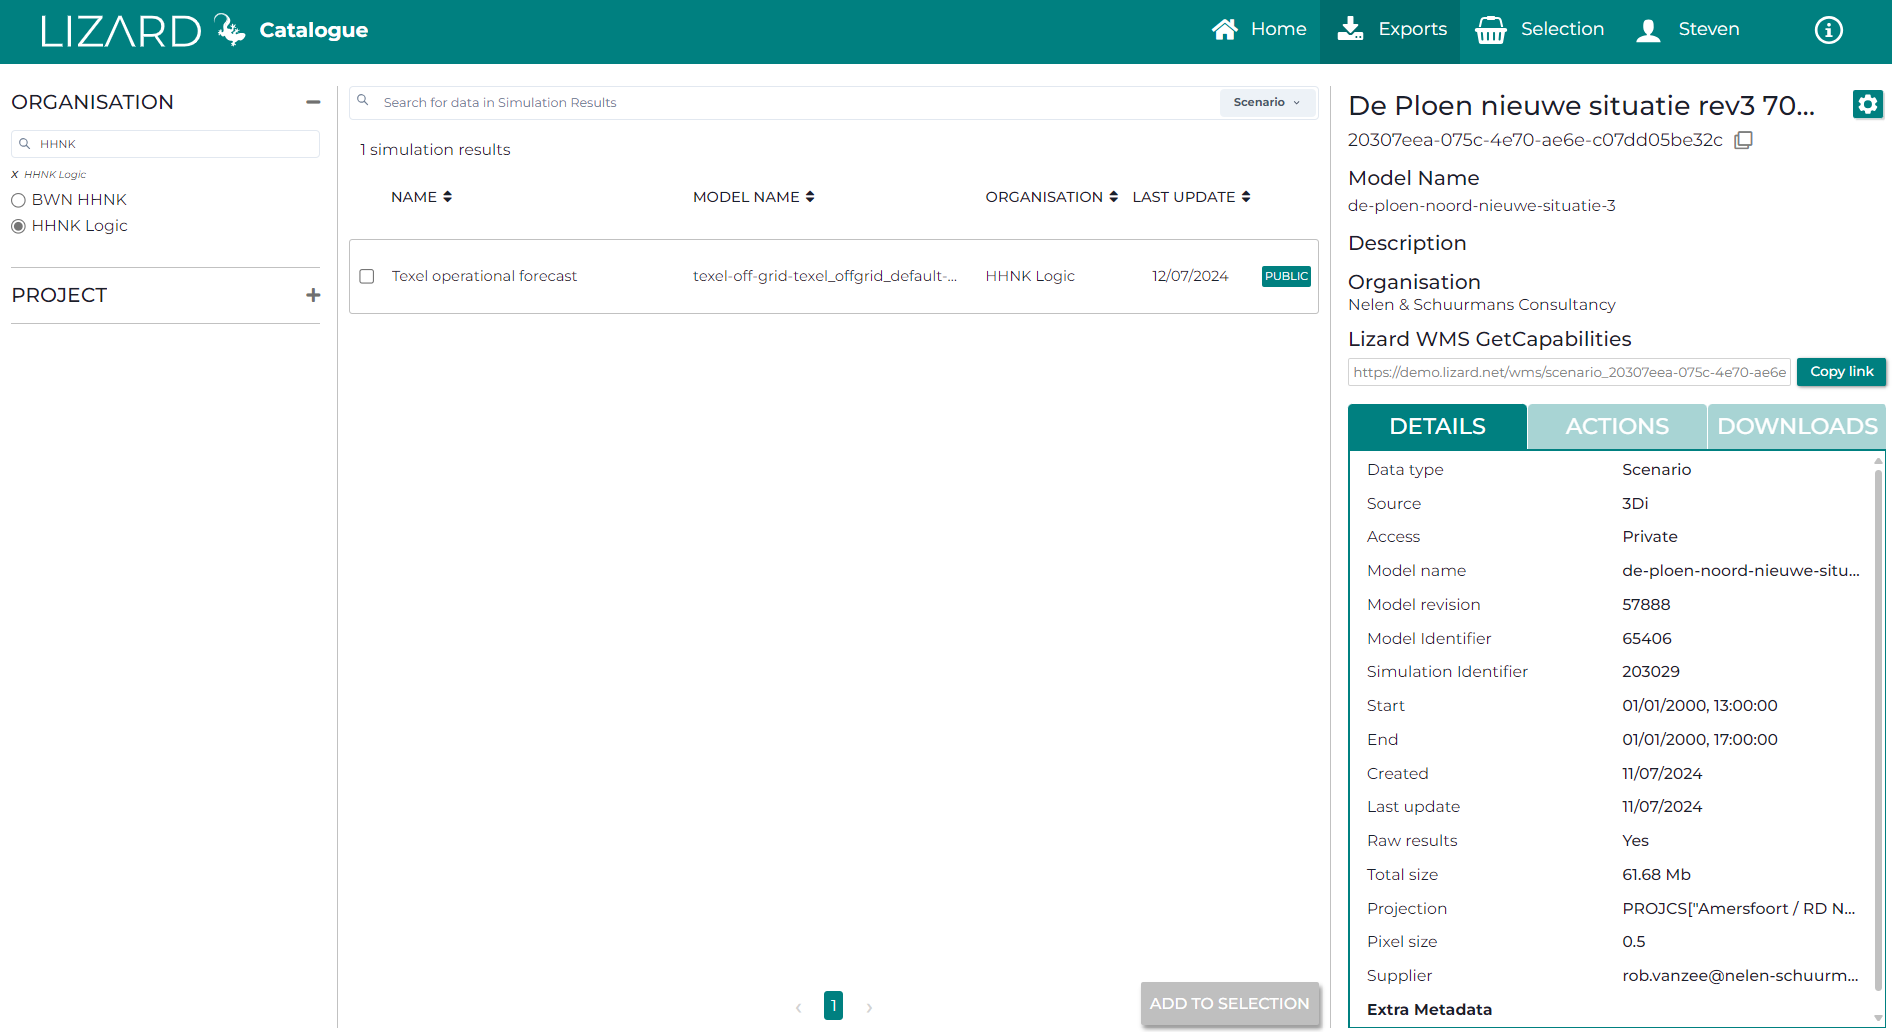
A simulation has a extensive details page, further more, you are able to download related files or view the scenario in the API or Viewer.
Note
Information about the different access modifiers can be found under organisation modifiers.
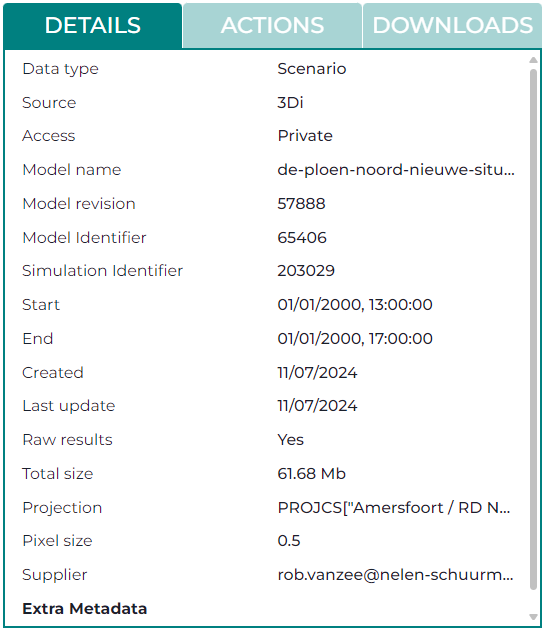
Details
Once you have selected a data layer, you will find detailed information about the layer in the panel on the right.
Action menu
In the action menu, you can open the scenario in the Viewer or in the API.
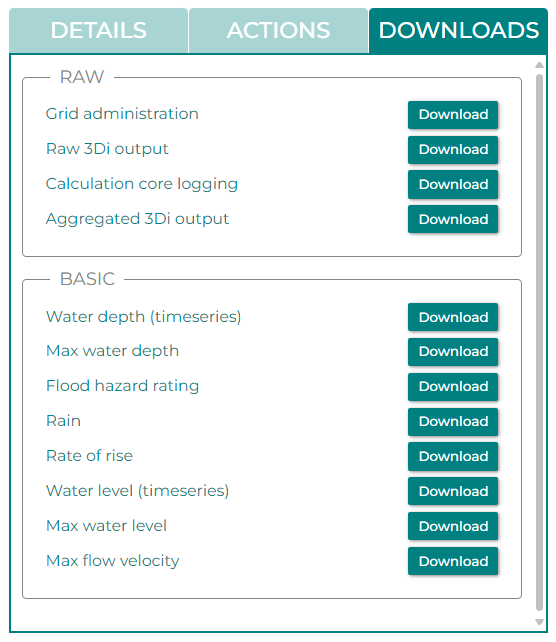
Downloads
The downloads section shows all related files. There are basic and raw files available.