Management
This page discusses the Management page that can be accessed through the Lizard homepage.
The management page links to four subpages:
Data
The data management page provides several options to interact with the data in the datawarehouse. These options are divided by the type of data:
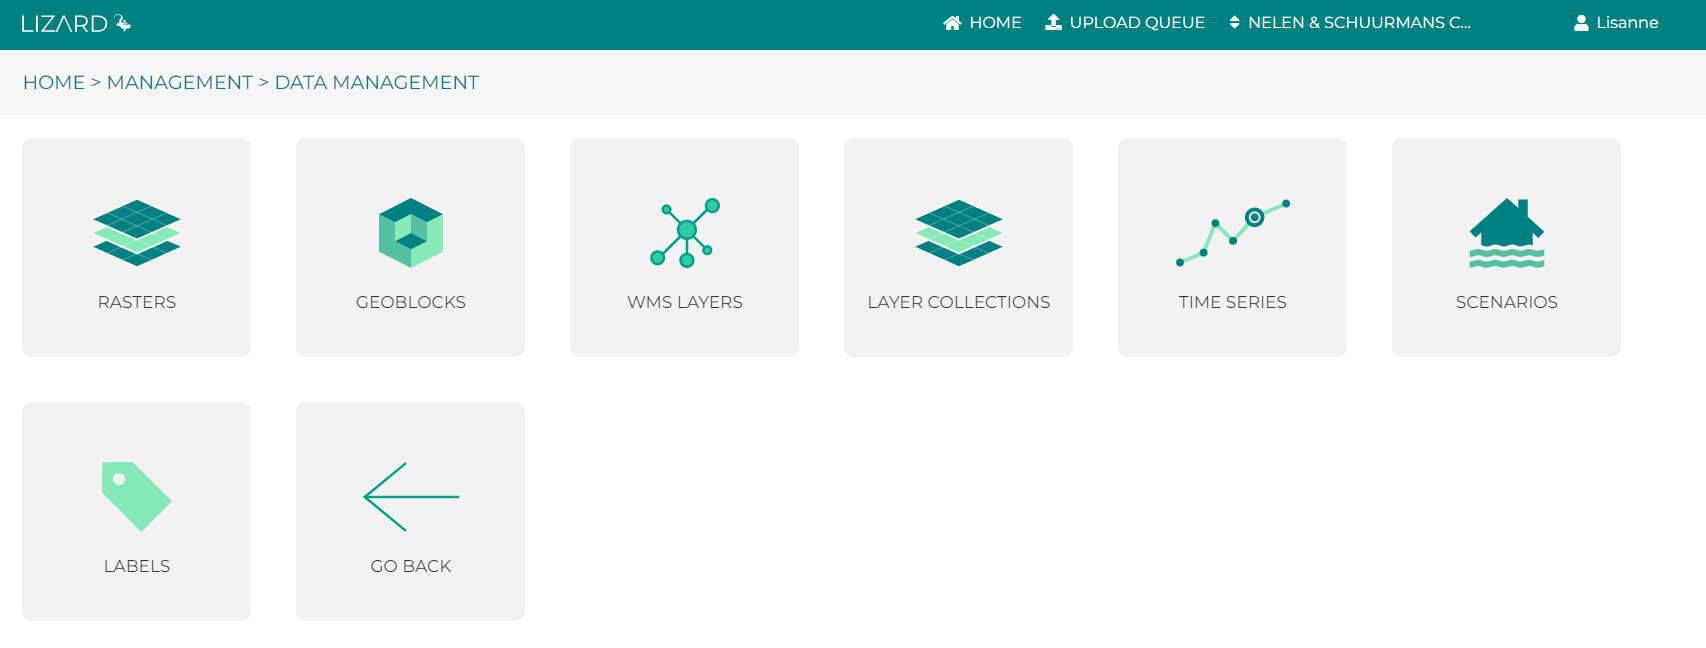
Rasters
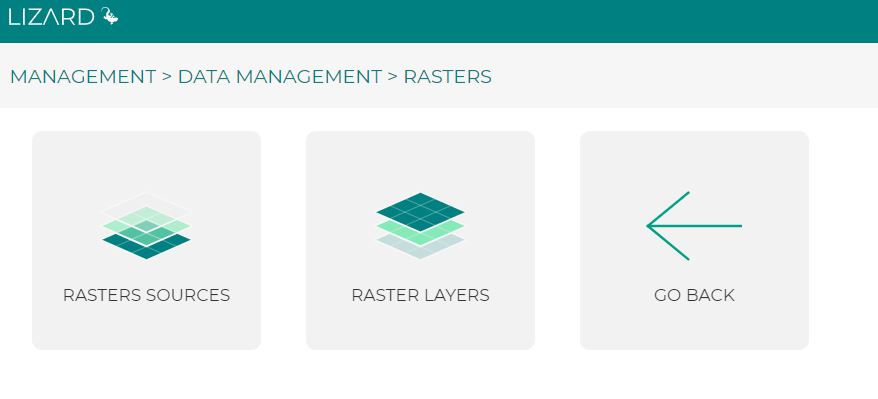
The data management interface for rasters can be used to upload, edit or remove rasters. Raster Sources are the data containers, Raster Layers are the configuration of how the data is visualised.
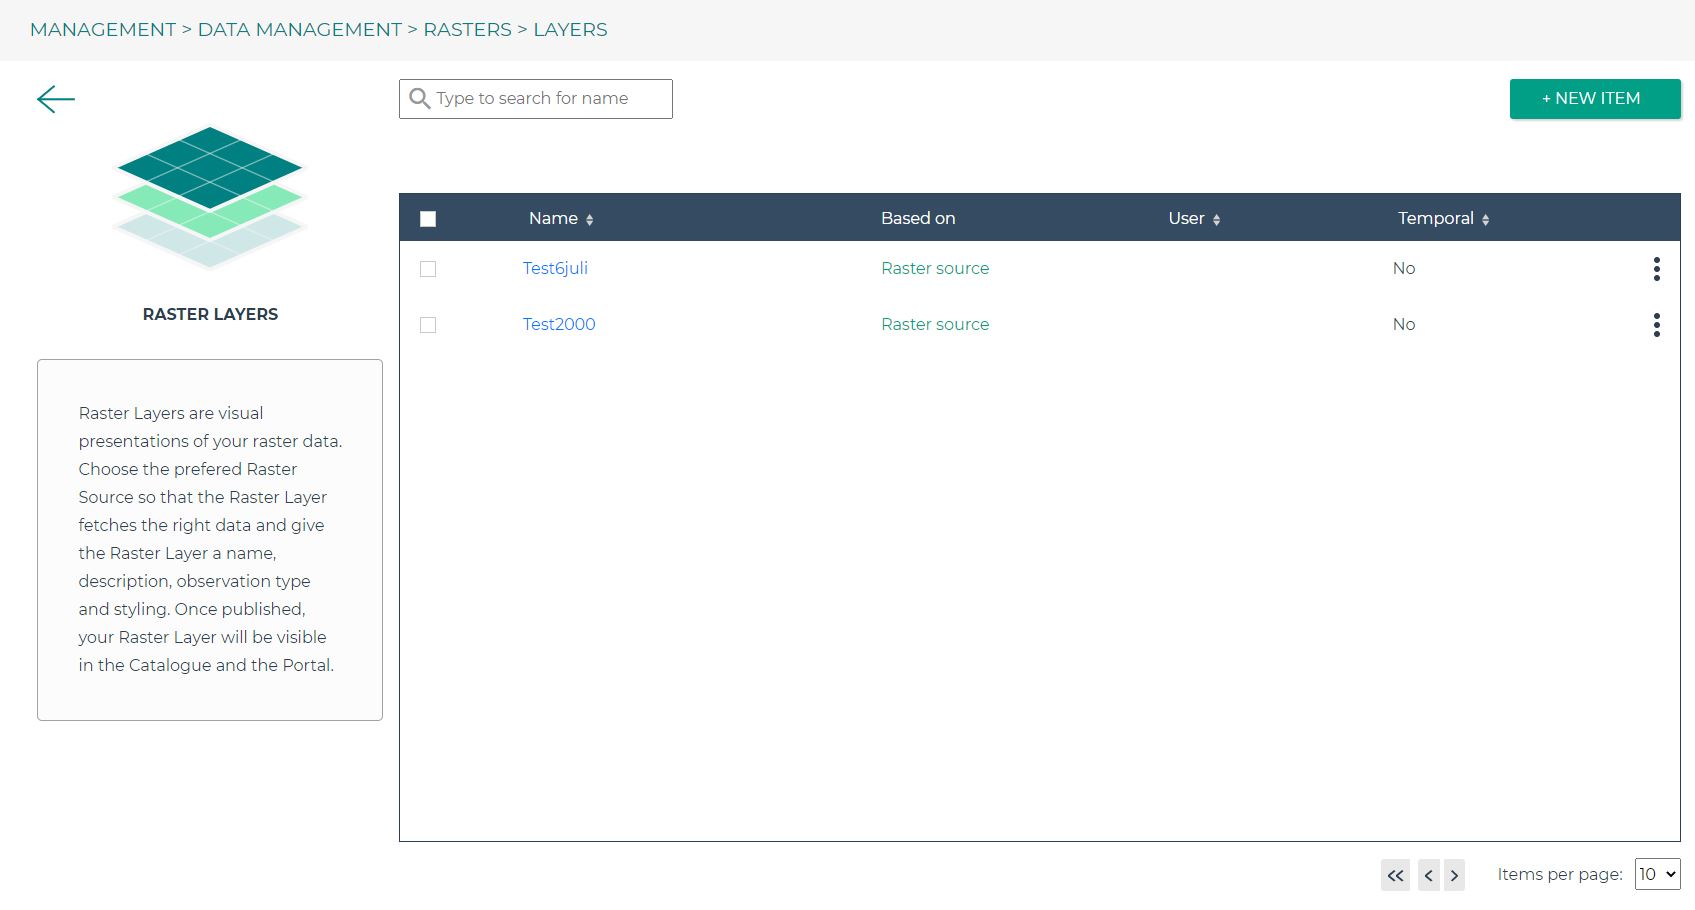
Creating and editing Raster Sources and Layers
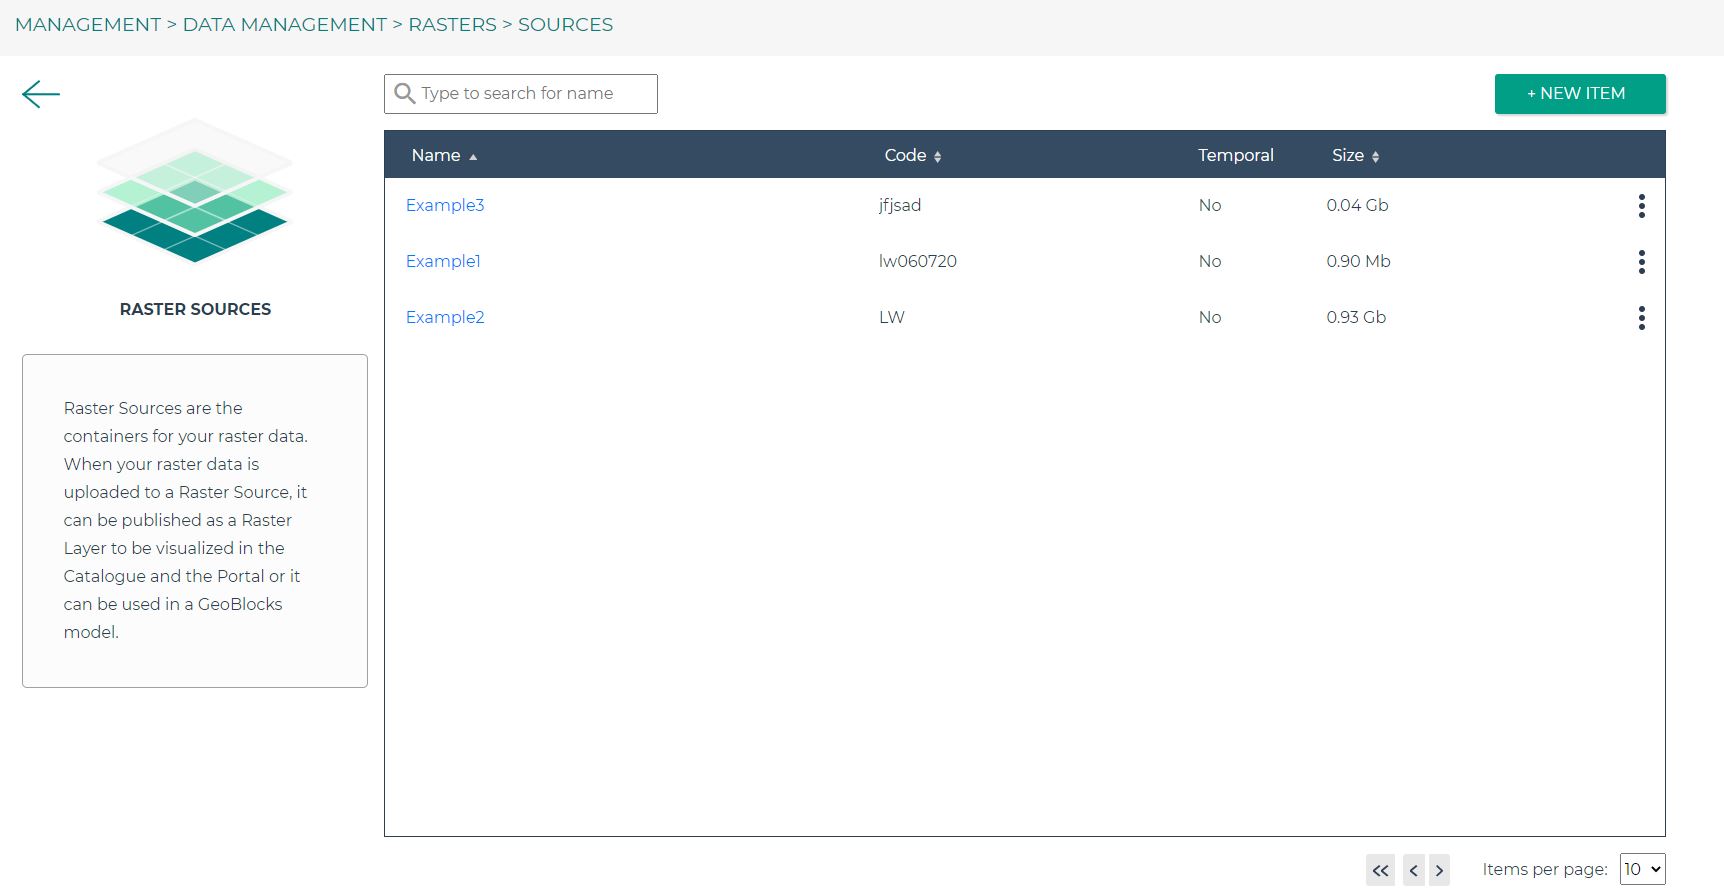
The first step in uploading your raster datasets is to create a Raster Source.
The Data Management interface is available at: “www.{your_organisation}.lizard.net/management/”.
After landing on this page, click on Data -> Rasters -> Raster Sources.
Click on “New Item”  to open the form or choose an existing raster to edit.
After filling in the form you can choose to directly upload your data by selecting your GeoTIFF’s in the ‘DATA’ section. In case of a temporal raster source you need to specify which file belongs to which timestep. This is recognised automatically if the filename is composed according to the specified format. When you save a new Source you will have the option to go straight to the Raster Layer form to publish your data.
Interested in the possibilities for your organisation? Please contact us via info@lizard.net.
GeoBlocks
The GeoBlocks management page provides you a powerful tool to build your GeoBlocks Rasters. It helps you configure complex GeoBlocks models and enables you to validate your work along the way.
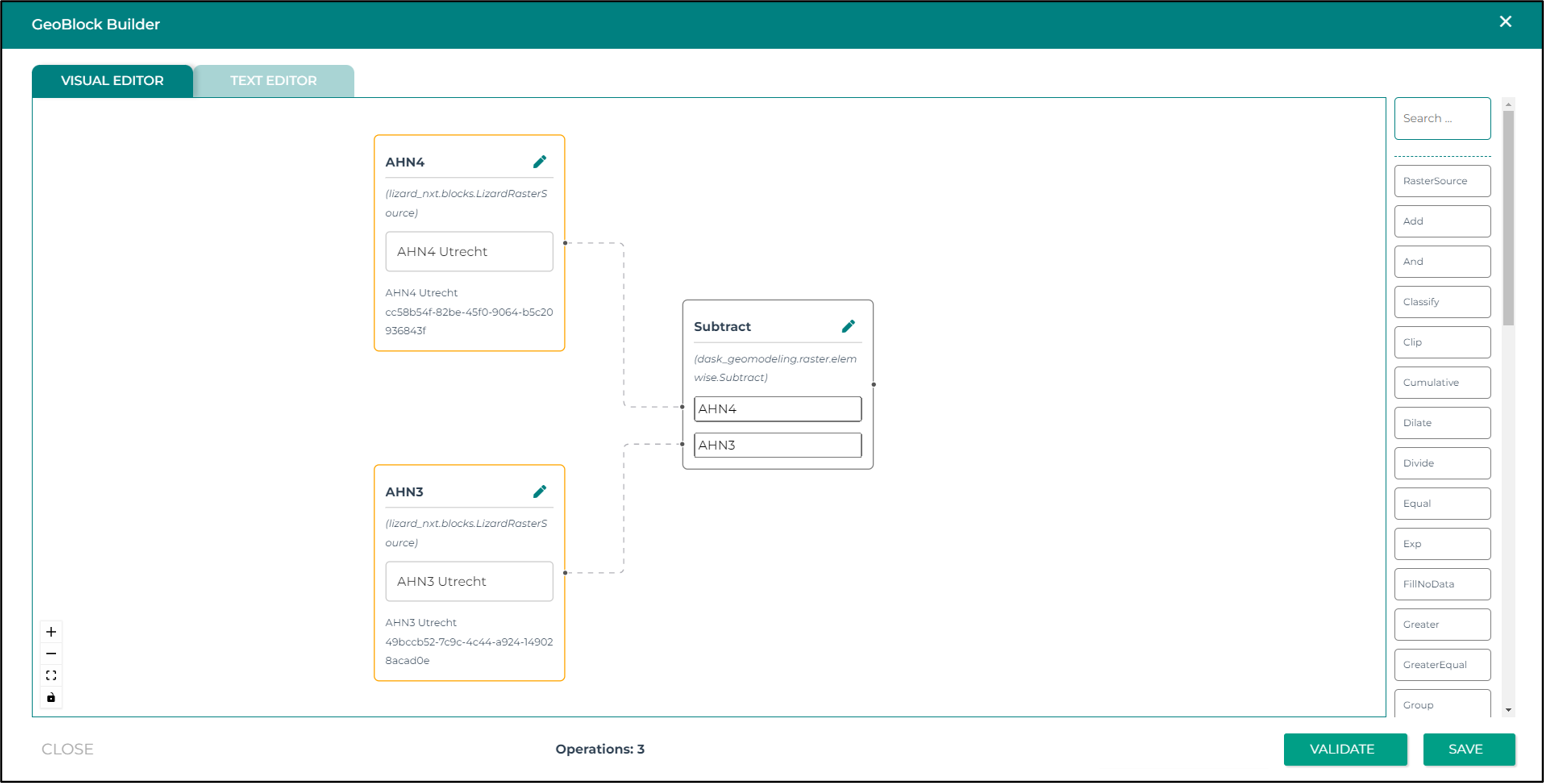
The Visual editor shows your model as a flow diagram, consisting of block objects representing the input Raster Sources and GeoBlocks operations. The right sidebar shows the available blocks. Click on the blocks for a description and the expected inputs. Drag a block into the canvas to include it in your model. Connect blocks to use one as input for the other.
When the model is valid it can also be shown in the Text editor. This shows the JSON graph as it would be sent to the API when you save the item. Here you can also make edits and validate the result.
Example 1 shows a simple model which subtracts one Raster Source from another (difference in surface elevation between two versions of a dataset).
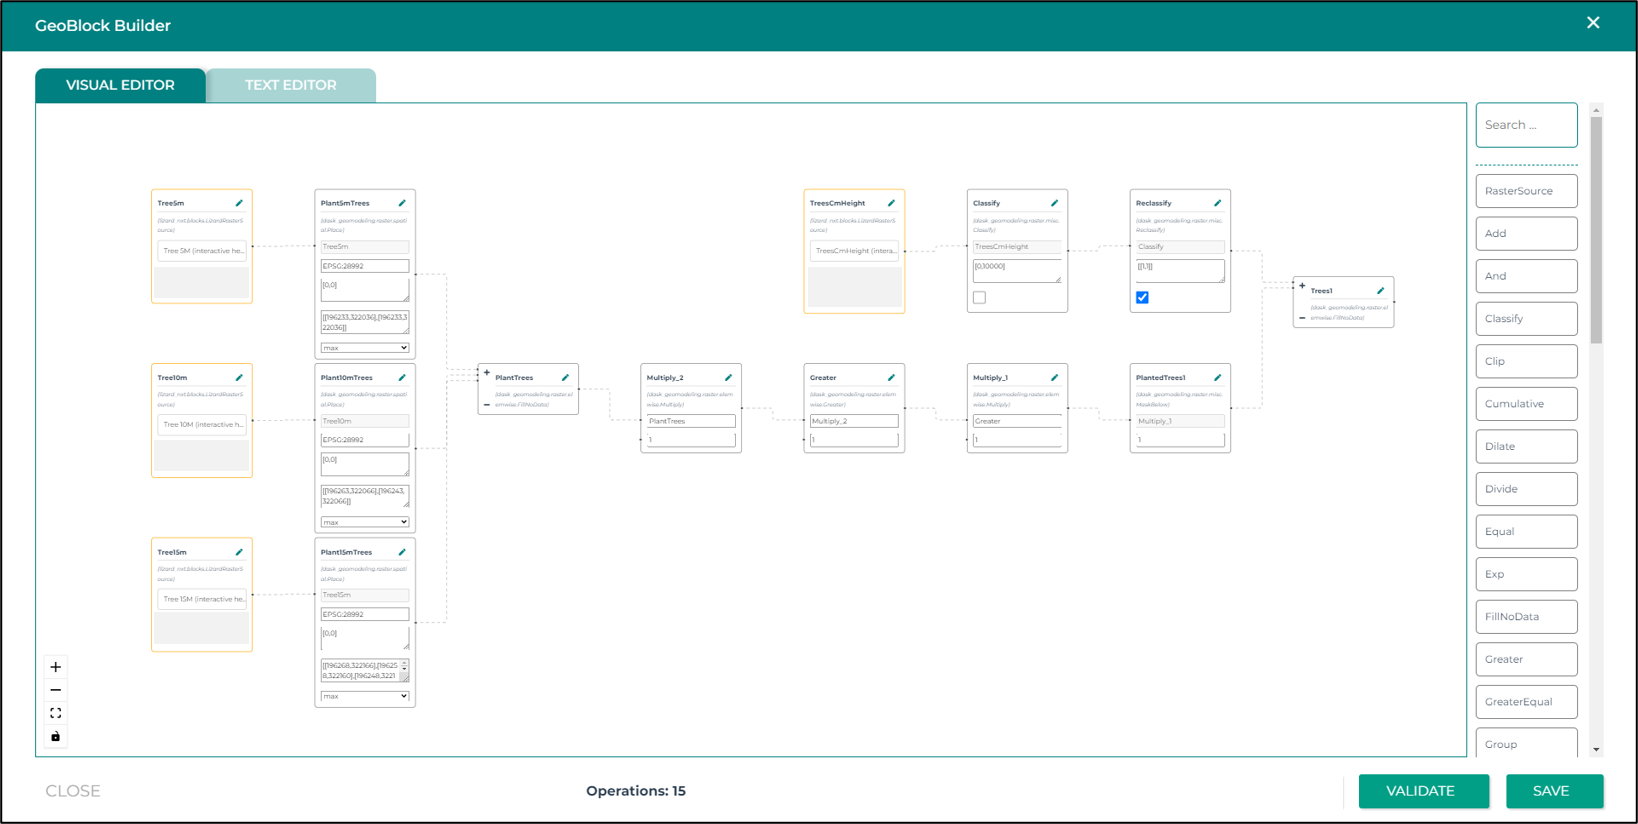
Example 2 shows a more complex model with multiple Raster Sources and a series of operations.
For more information about the possibilities of GeoBlocks see: GeoBlocks
WMS Layers
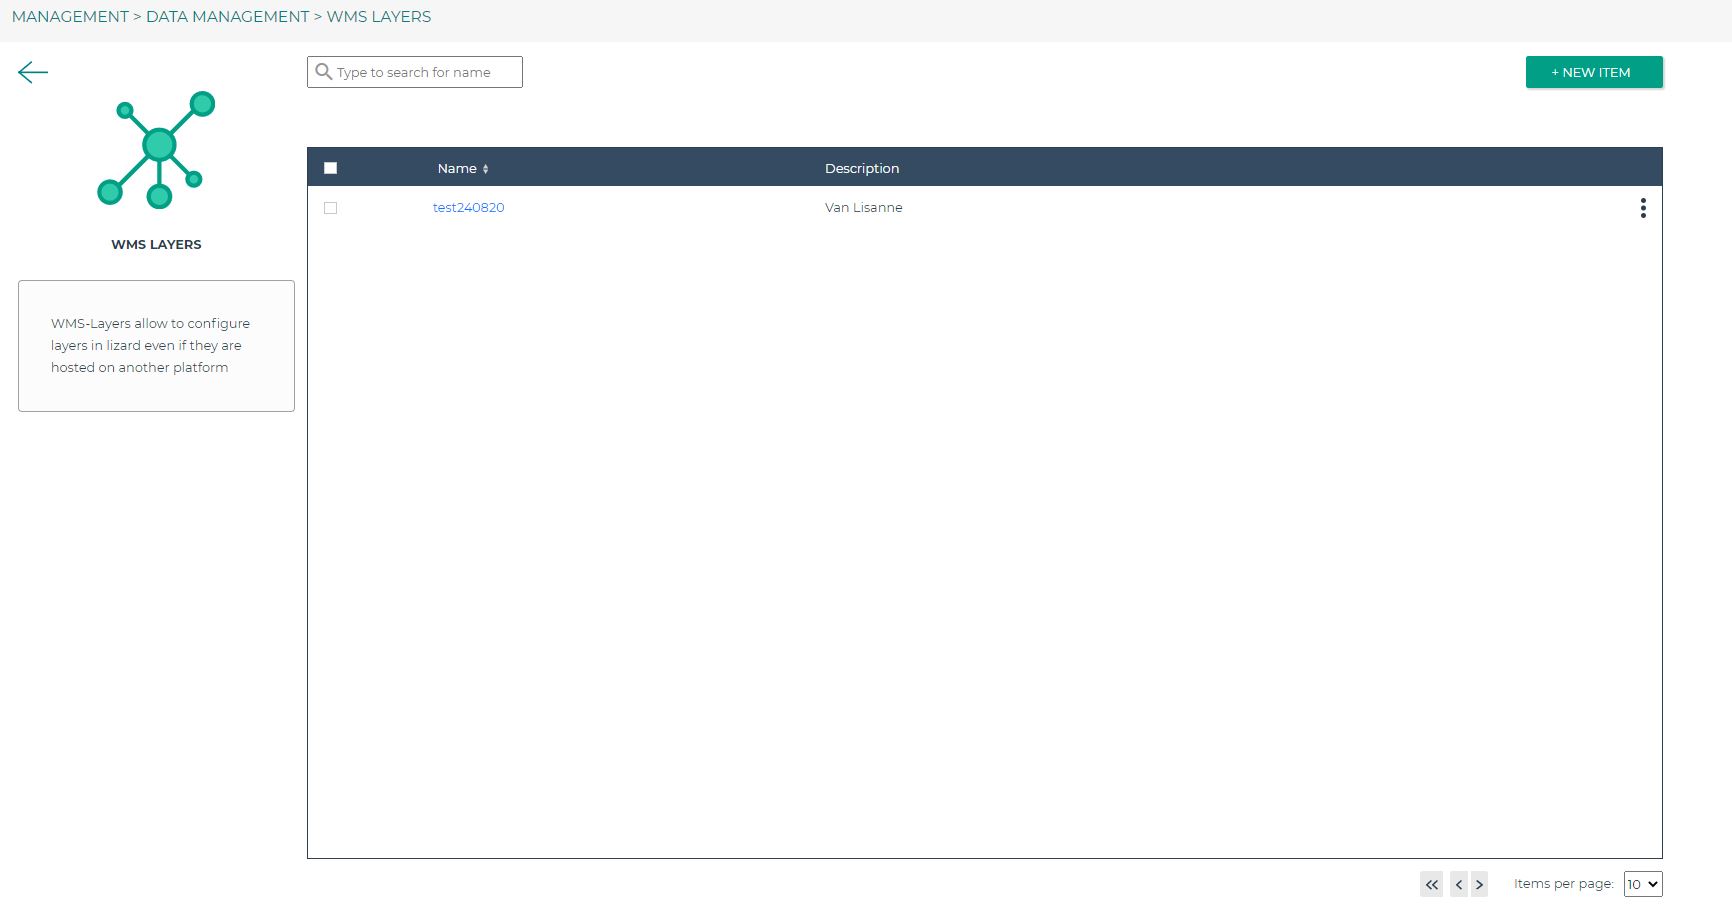
WMS stands for Web Mapping Service. It is a standard method of sharing georeferenced maps. The WMS layers management allows the user to configure layers in Lizard even if they are hosted on another platform. In the management screen you can add new WMS layers or edit existing layers.
New WMS Layer
After clicking the ‘NEW ITEM’ icon, you can configure a new WMS layer.
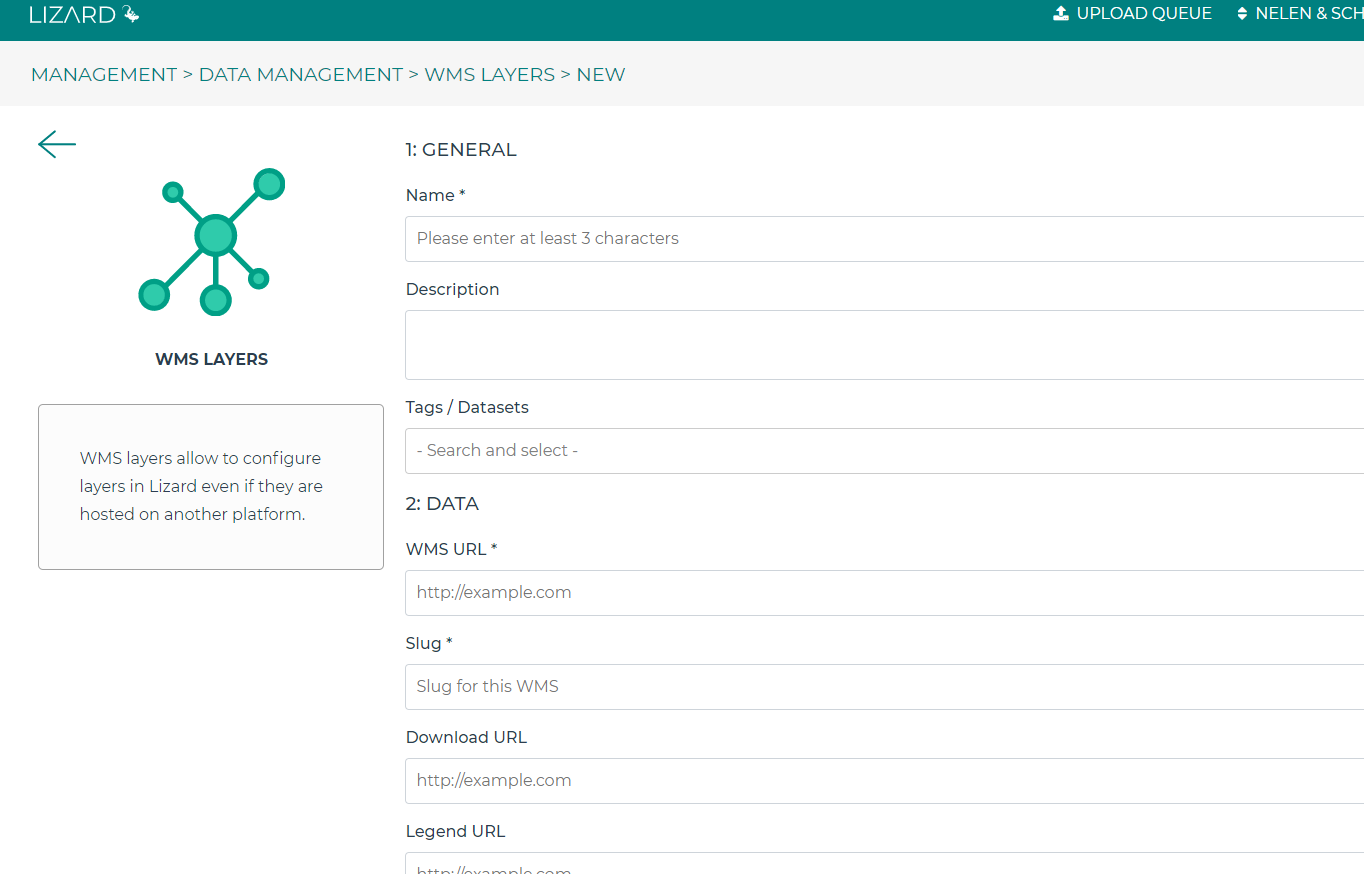
The configuration has some mandatory items while others are optional, an extensive list with descriptions follows:
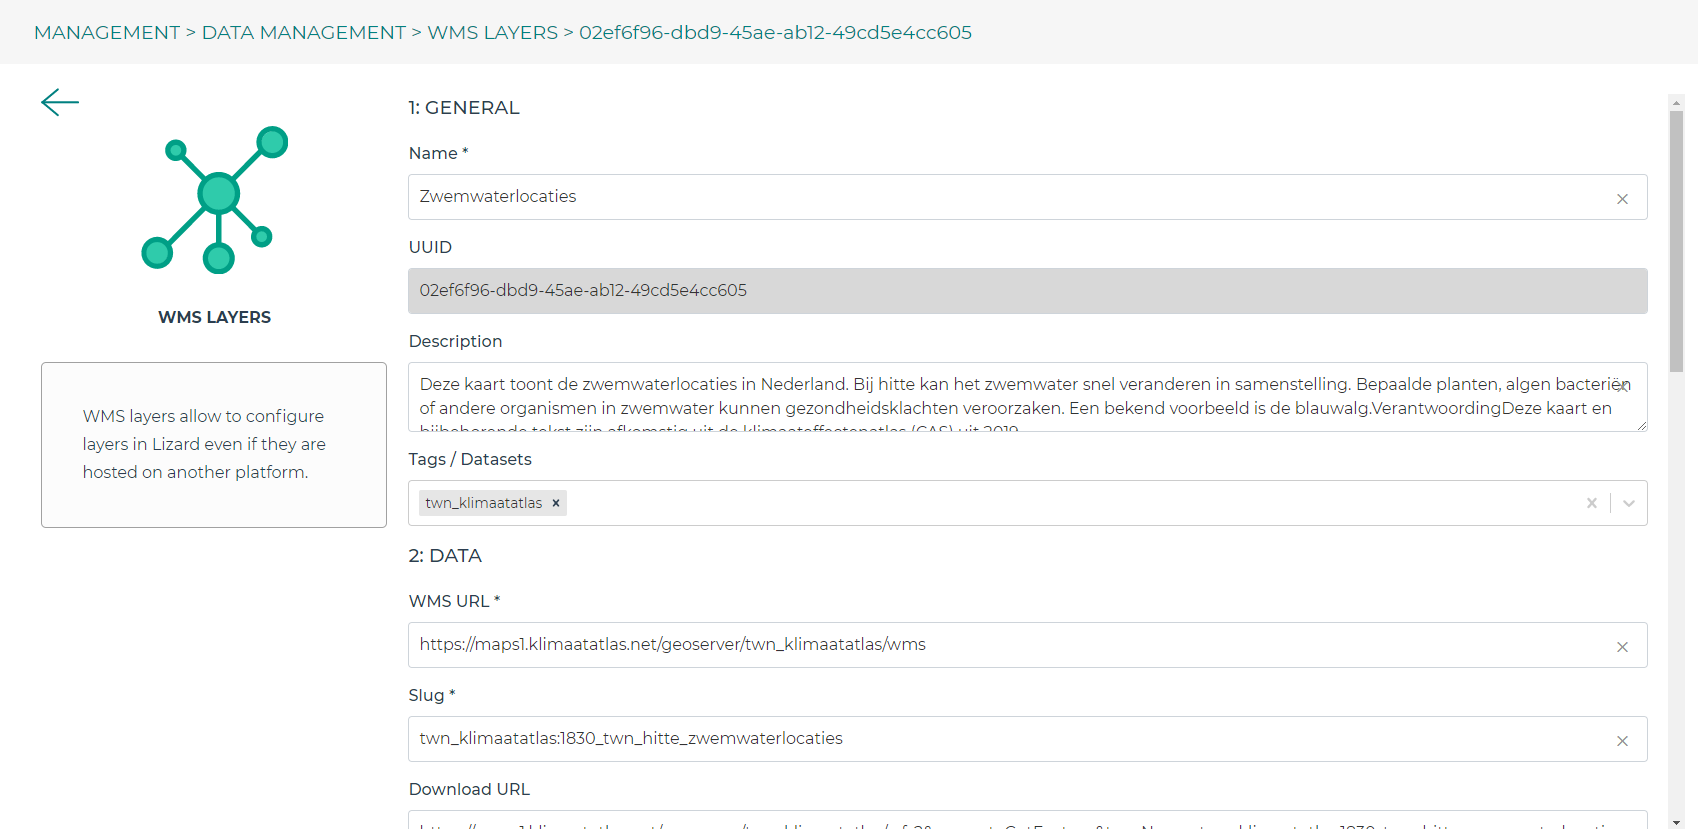
1. GENERAL
Name (required): Choose a name that is findable and not too difficult
Description (optional): Give a description of the information that is displayed by the WMS layer.
Tags / Datasets (optional): You can connect the layer to an existing dataset.
2. DATA
WMS URL (required): Specify which base URL is used to retrieve the image data. It usually ends on ‘/wms’
Slug (required): can be seen as layer name used in the external platform
Download URL (optional): Specify which URL is used to download the data. This will enable the download button in the Lizard Catalogue.
Legend URL (optional): Specify which URL is used to show the legend of this layer.
Get Feature URL (optional) : Optional URL to retrieve feature info data.
Tiled (enabled by default) : Specifies whether the layer is tiled (for better performance)
Min and max zoom (required): Closest and furthest point of view in this WMS layer. 0 is visible at world scale, 31 is zoomed in at a house. You can check the zoom level in the url in the Viewer (after the coordinates).
Spatial bounds (optional): Specify the extent of this layer on the map. This information can also be automatically obtained by clicking “Get from source”.
Options (JSON): Extra options of this layer, specfied in JSON.
3. RIGHTS
Accessibility (required, private by default): Choose an access modifier to decide who has access to this object.
Shared with (optional): Specify if this object should be accessible by other organisations, and if so, which ones.
Organisation (required, pre-filled): The organisation this object belongs to.
Supplier (optional): The supplier of this object. If you are not an administrator, this field is always pre-filled with your username.
If you are satisfied, click “SAVE”
Edit WMS Layer
By clicking on the name of a WMS layer, the configuration of the corresponding layer is opened. In the configuration page you can edit any of the settings previously given to the WMS layer. To quickly find a WMS layer: use the search bar. If the layer you are looking for seems unavailable you might have to switch organisations, feel free to contact the servicedesk for any problems (servicedesk@nelen-schuurmans.nl).
Tip
Advanced: Is your WMS layer not visible in the Viewer? Check via the network tab (press F12) how Lizard requests the WMS and if that WMS url makes sense.
WMS Services
Lizard provides a Web Map Service (WMS) that you can use to visualise rasters and 3Di scenarios stored in Lizard Raster Server as tiled images. The Lizard WMS Service follows the OGC WMS guidelines.
Rasters
To visualise and request the GetCapabilities of a specific raster you can use the following URL:
https://{yourportal}.lizard.net/wms/raster_{UUID of raster}/?request=GetCapabilities
for example: https://demo.lizard.net/wms/raster_eae92c48-cd68-4820-9d82-f86f763b4186/?request=GetCapabilities
You can easily find the UUID of the raster in the Lizard Catalogue or API. The Lizard Catalogue also provides the Lizard WMS GetCapabilities link for each raster. With the GetCapabilities query parameter you retrieve the metadata of the service, including supported operations, parameters and a list of available layers.
3Di Scenarios
To visualise and request the GetCapabilities of a 3Di scenario (list of rasters) you can use the following URL:
https://{yourportal}.lizard.net/wms/scenario_{UUID of scenario}/?request=getcapabilities
For example: https://demo.lizard.net/wms/scenario_c30ef7f2-c871-4d70-a087-8f078f9ebafd/?request=GetCapabilities
You can look up the UUID of the scenario using the Scenarios endpoint in the Lizard API. All available filters are listed on the endpoints’ page. E.g. you can look up a scenario and it’s uuid by filtering on your own username. With the GetCapabilities query parameter you retrieve the metadata of the service, including supported operations, parameters and a list of available layers.
Layer collections
To visualise and request the GetCapabilities of layer collections (list of rasters, previously called ‘datasets’) you can use the following URL:
https://{yourportal}.lizard.net/wms/{slug of layer collection}?request=GetCapabilities
For example: https://demo.lizard.net/wms/basiskaarten/?request=GetCapabilities
You can search for layer collections in the Lizard Catalogue by using the Layer collection filter in the left panel. You will find the Lizard WMS GetCapabilities URL of the layer collection in the metadata panel of a specific layer.
How to load WMS in GIS
You can connect directly to Lizard in a GIS application like QGIS.
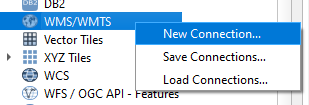
1
Open QGIS and load a new WMS connection.
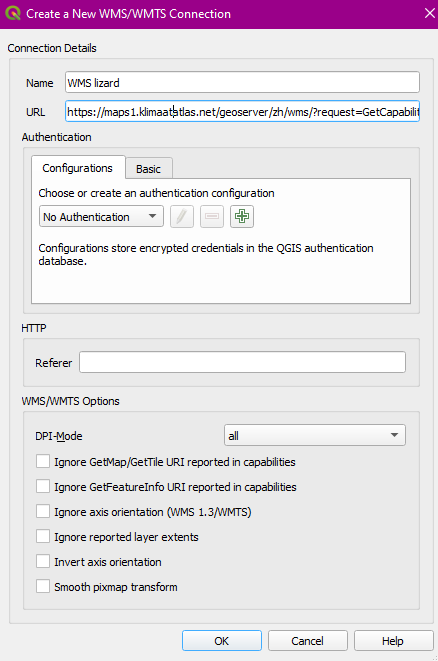
2
Give the connection a name and copy the wms link from ‘https’ to ‘GetCapabilities’, e.g. “https://maps1.klimaatatlas.net/geoserver/twn_klimaatatlas/wms/?request=GetCapabilities”.
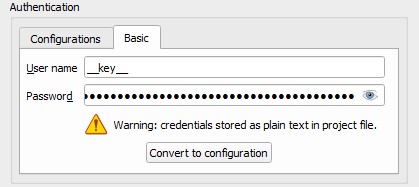
3
If the wms layer is not public, you have to enter your Credentials. in the Authentication - Basic tab.
4
Click OK and double click on the connection. If multiple layers appear, double click on the one you are interested in.
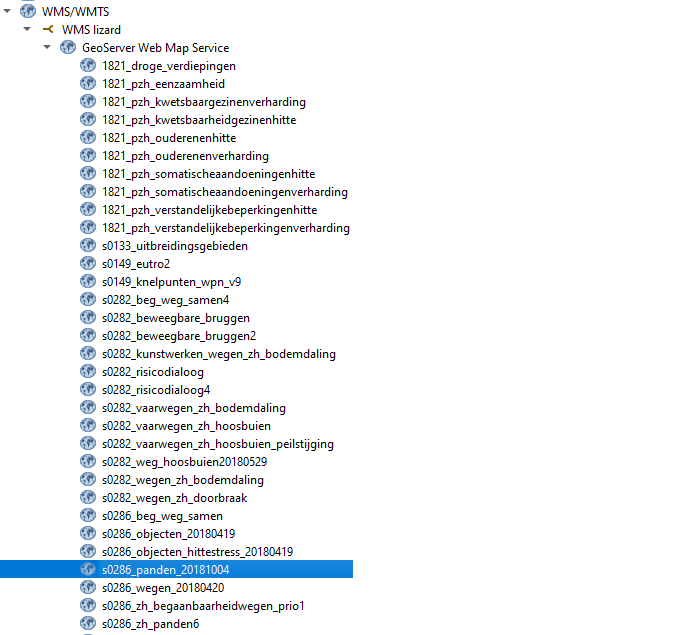
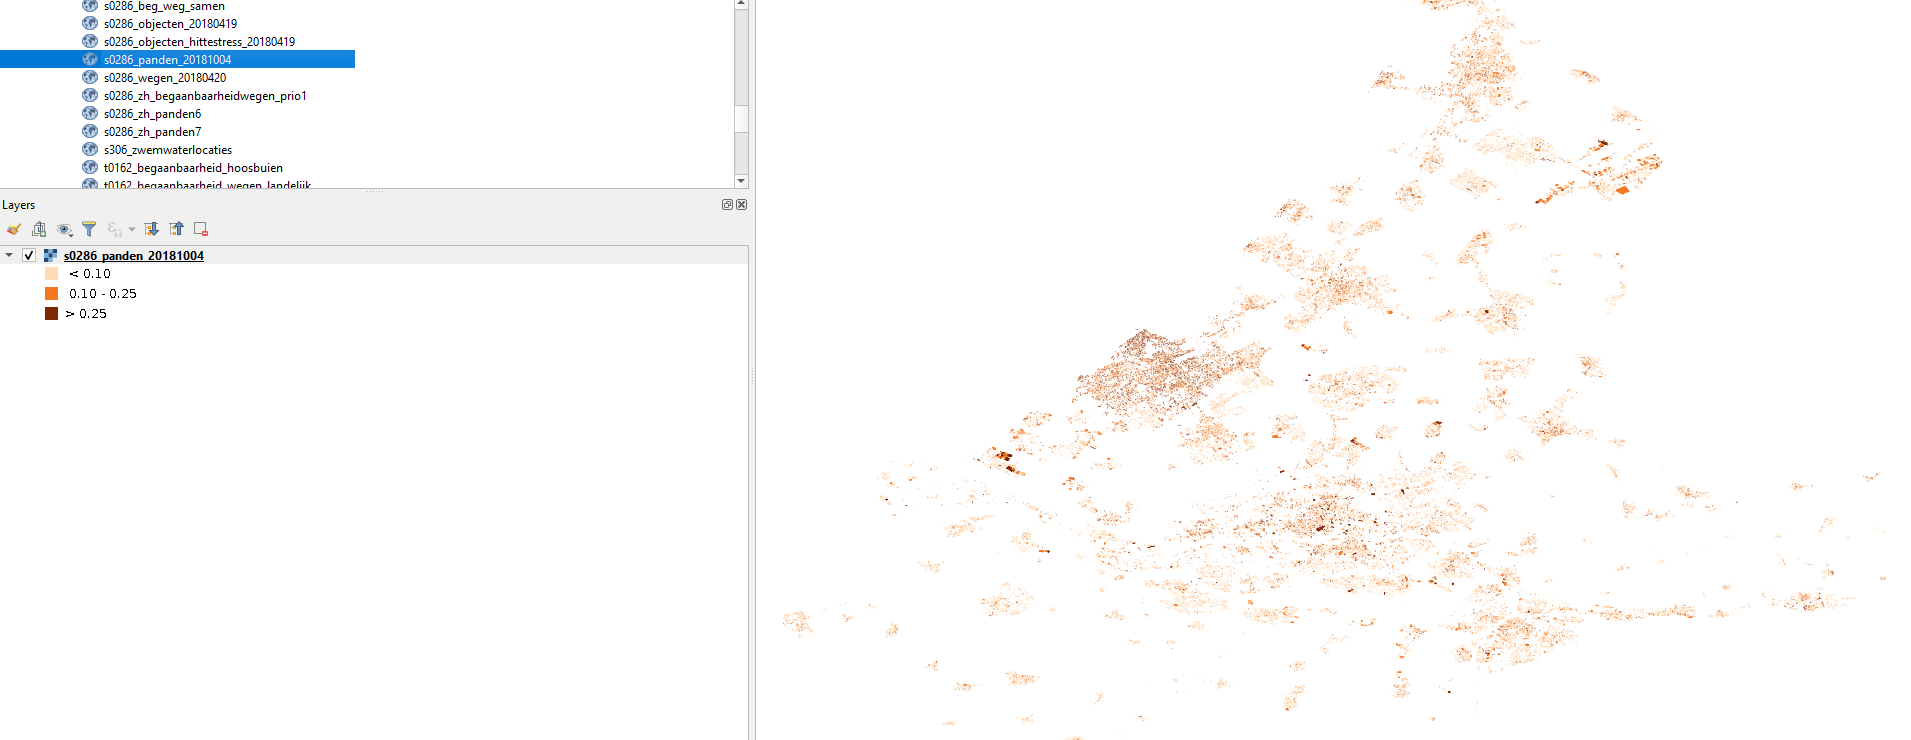
The styling will automatically be taken from Lizard. If the layer is temporal, you can also navigate through time.
Layer collections
Warning
This section will be extended in the near future.
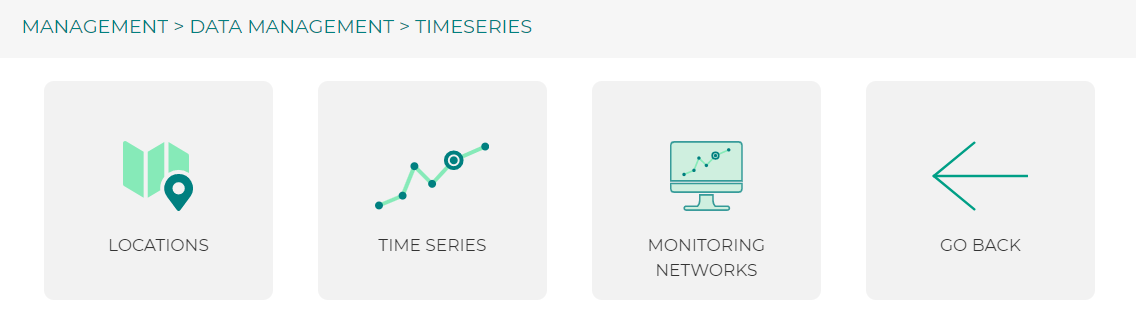
Time series
The data management interface for timeseries can be used to upload, edit or remove timeseries, monitoring networks and locations.
Locations
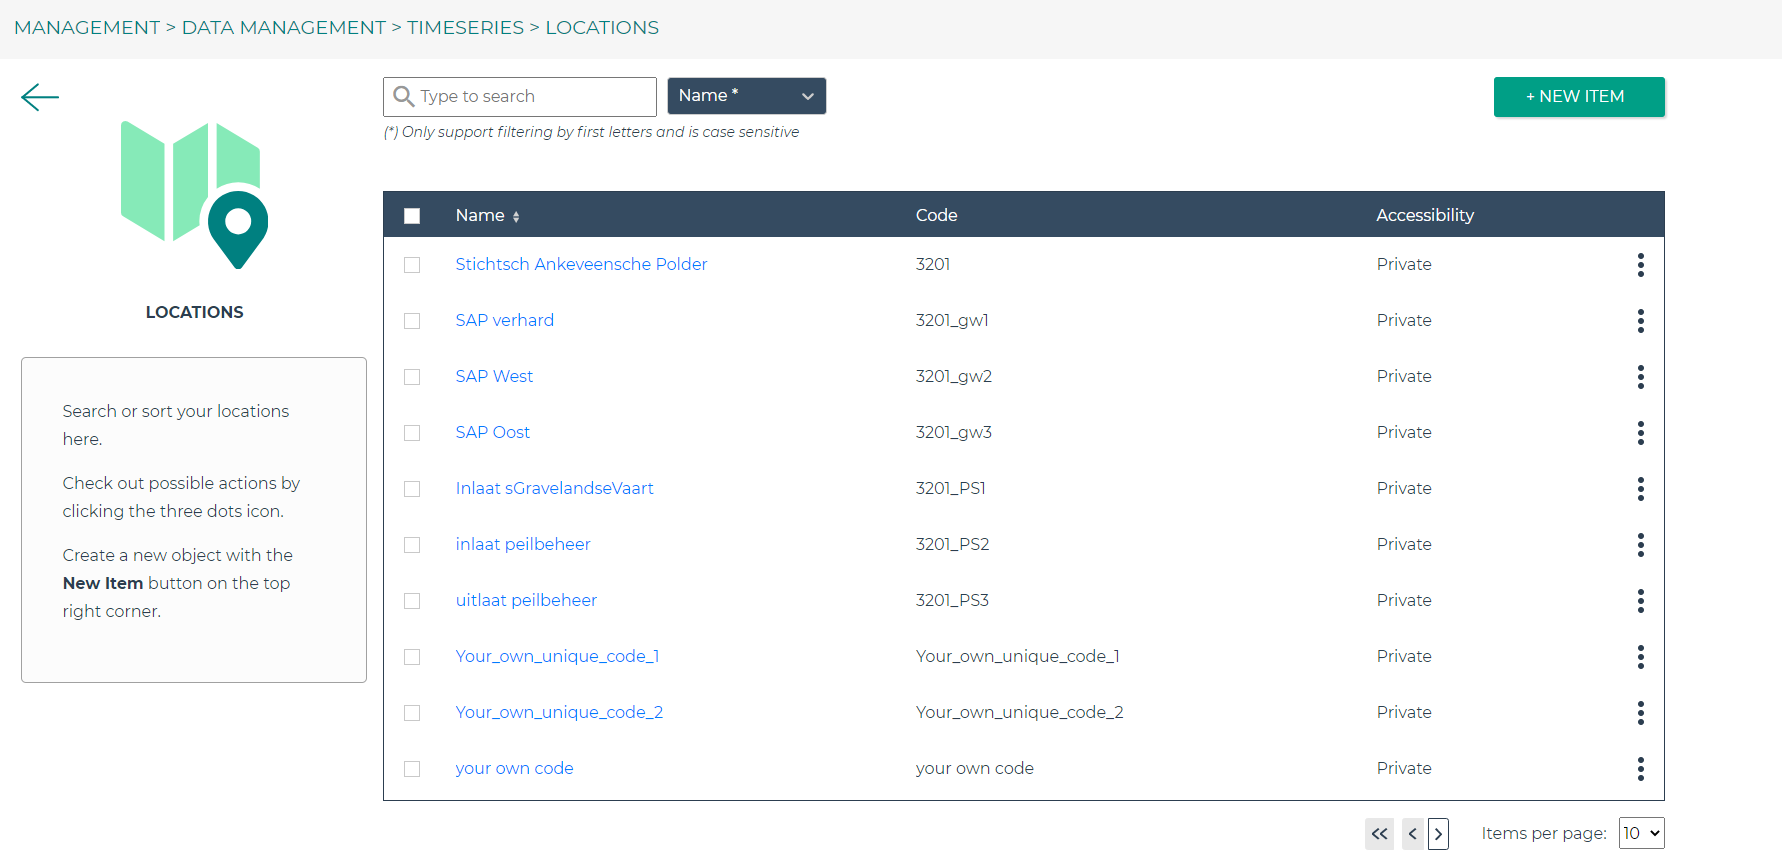
Search or sort your locations here. Check out possible actions by clicking the three dots icon. Create a new object with the New Item button on the top right corner.
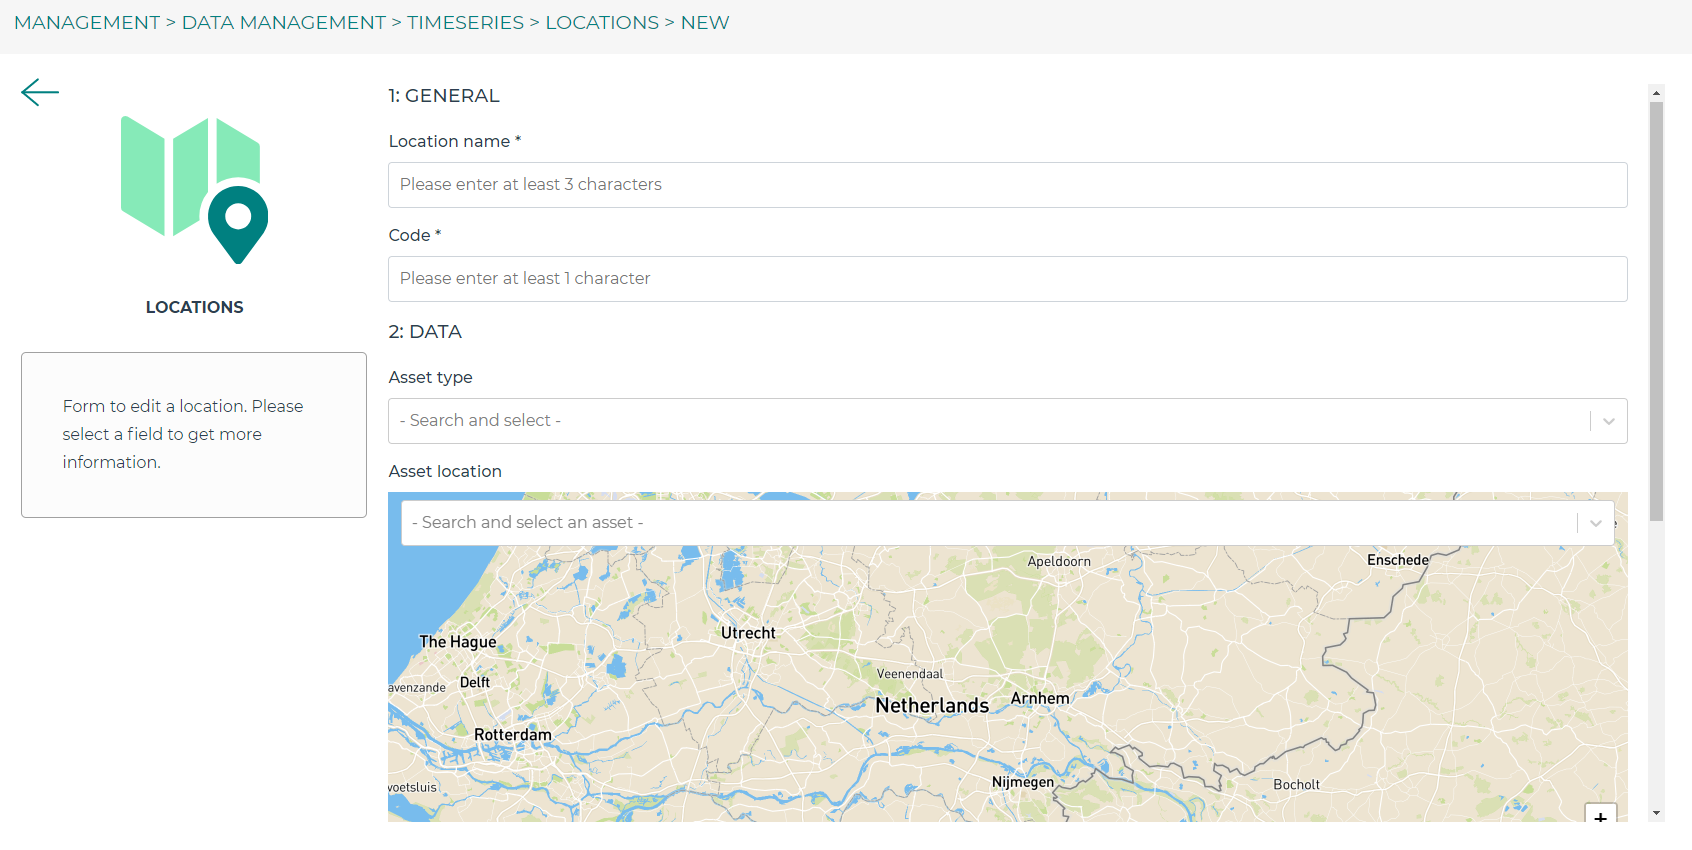
GENERAL
Location name (required): Choose a name that is findable and not too difficult
Code (required): Choose a code that represents the object within your organisation.
DATA
Warning
- Locations must be connected to an existing asset to be visualised in the Viewer.
An asset is an object such as a measuring station or weir. The asset will have a symbol and zoom level depending on the type. Also, the metadata differs per type. If you have any questions about this, please contact the service desk.
Asset type (optional): Specify a type of asset.
Asset location: after specifying the asset type, you can search by code or name.
Extra metadata (JSON) (optional): Free JSON field to add information to this object.
RIGHTS
Accessibility (required, private by default): Choose an access modifier to decide who has access to this object.
If you are satisfied, click “SAVE”
Timeseries
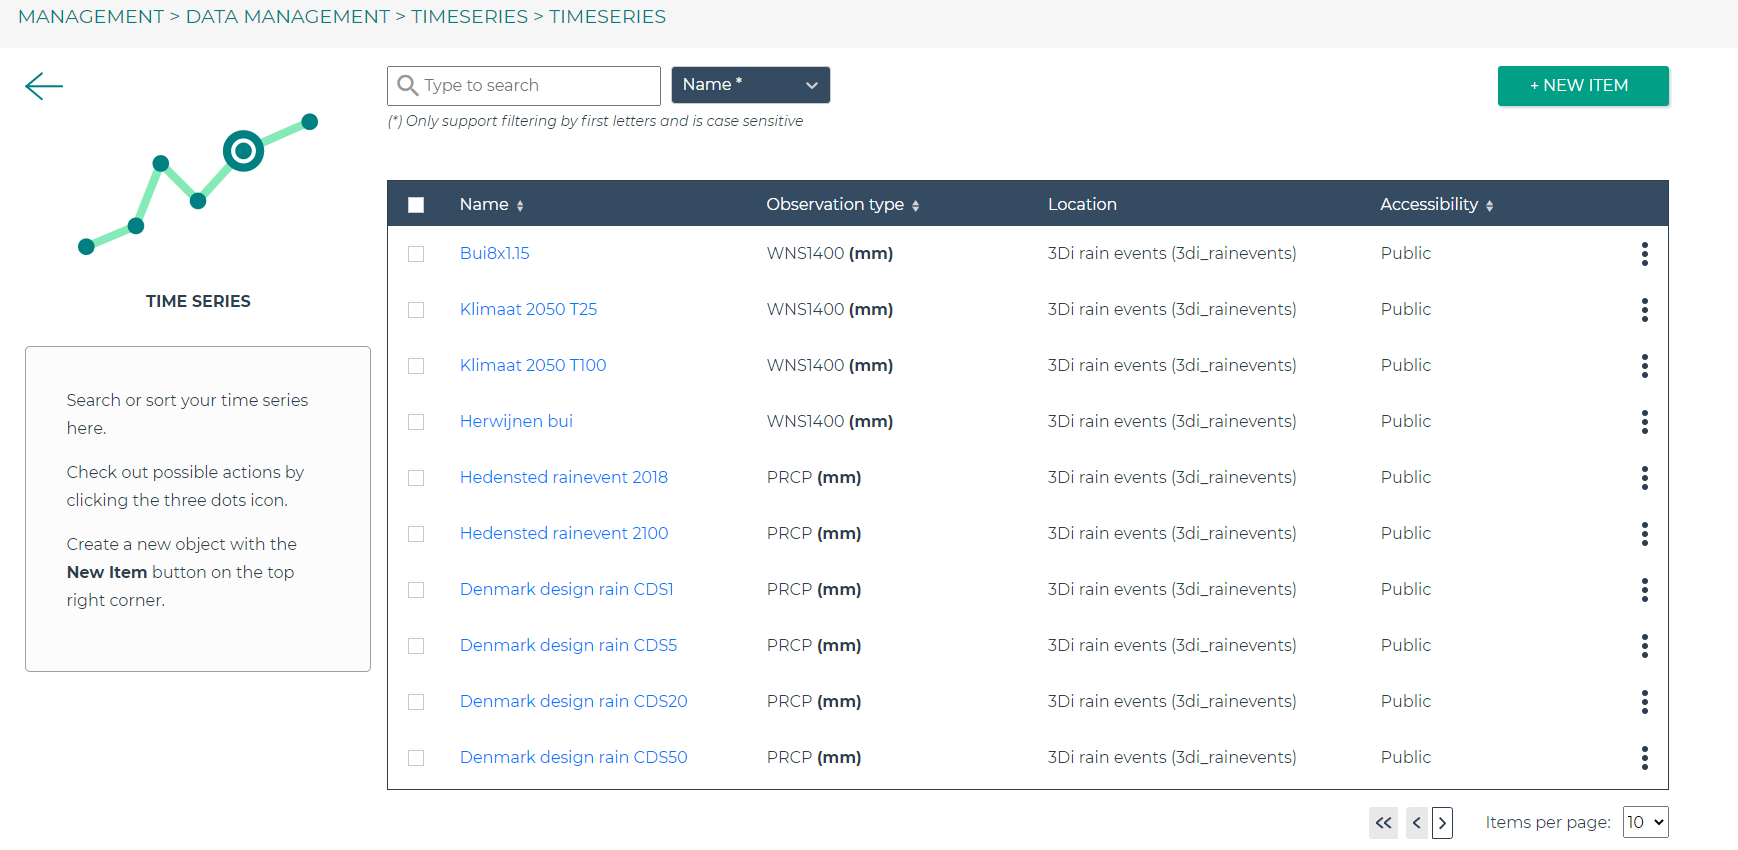
Search or sort your time series here. Check out possible actions by clicking the three dots icon next to a time series. You can add timeseries to a monitoring network (MN), edit, or delete hem. Create a new object with the New Item button on the top right corner.
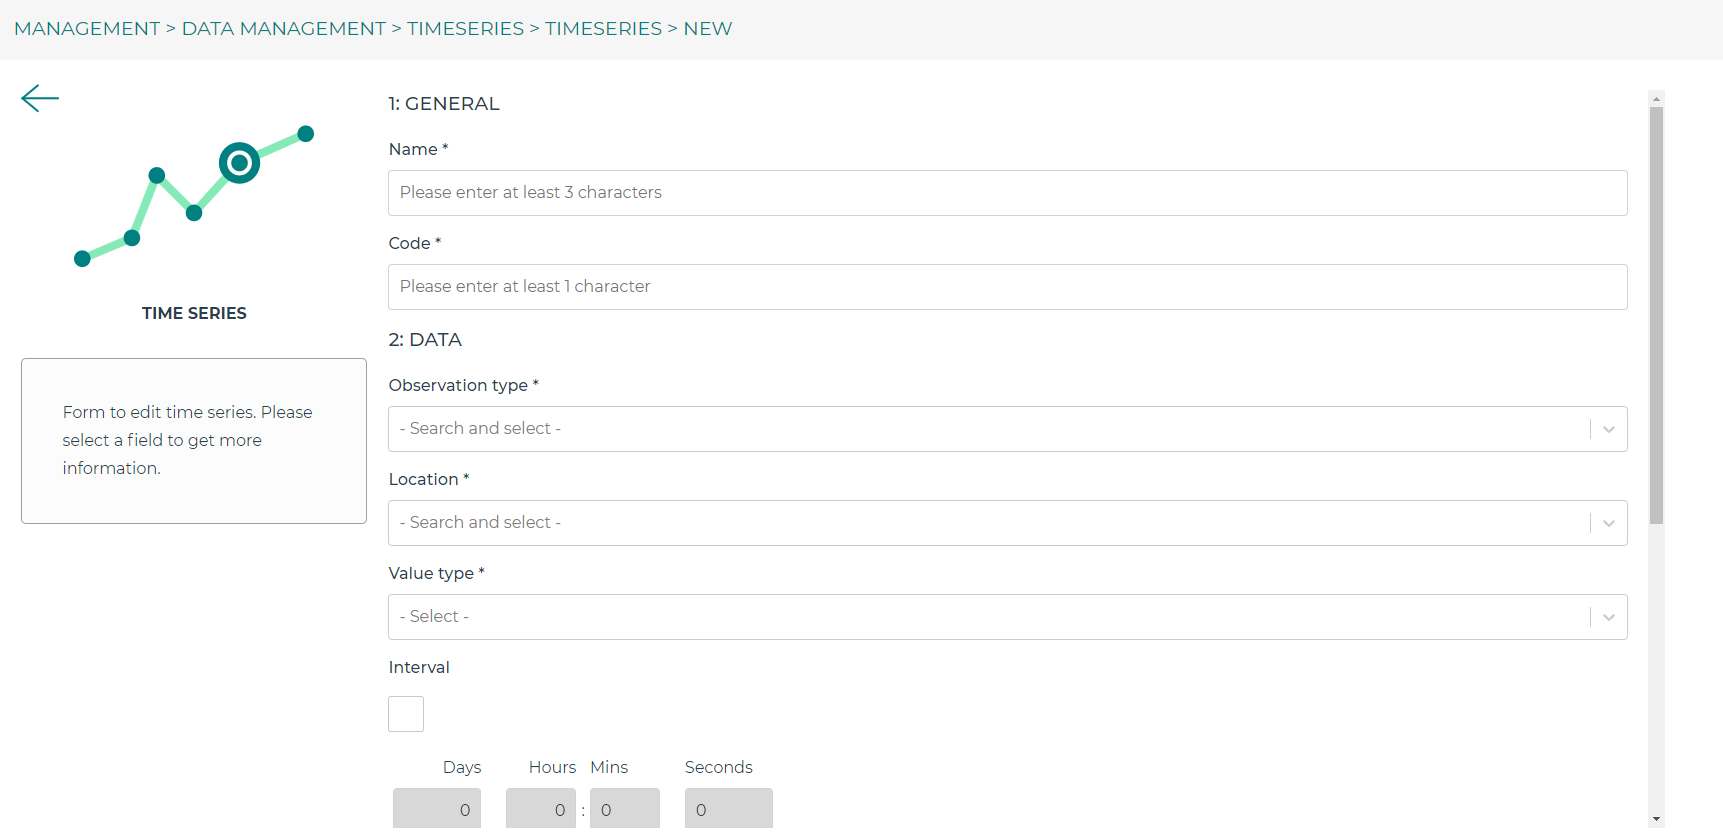
GENERAL
Name (required): Choose a name that is findable and not too difficult
Code (required): Choose a code that represents the object within your organisation.
DATA
Observation type (required): Choose the way the data is measured, and the units. New observation types can be added via the observation types api or requested via the servicedesk.
Location (required): Choose to which location you want to add this timeseries. New locations can be added via the api or via data management –> timeseries –> locations.
Value type (required): Specify what kind of data you will be supplying. See Level of measurement.
Datasource (optional): Specify a data source if it is available. Otherwise, you can leave it empty or create a new one via the API.
Interval (optional): Specify a time range between each time series step.
Note
if you leave the interval at 0, it will mean it is irregular (‘nonequidistant’) data. This is also necessary if you have timesteps smaller than seconds.
CSV Files (optional): You can add new data via a csv file or via the API. If you want to supply a csv file, see the instructions below:
Note
The first line of the file should describe the column names, for example:
The next lines are the timestemp and value for that timestep. Make sure you do not list the same timestep twice. All uploads in Lizard are expected to be in UTC time.
Extra metadata (JSON) (optional): Free JSON field to add information to this object.
RIGHTS
Accessibility (required, private by default): Choose an access modifier to decide who has access to this object.
Username of supplier (optional): The supplier of this object. If you are not an administrator, this field is always pre-filled with your username.
Supplier code (optional): The FTP or Supplier code is used as reference to your own system.
Note
Timeseries are not linked to an organisation directly. They are linked to organisations via the locations.
If you are satisfied, click “SAVE”
Monitoring networks
Monitoring networks are used to group and give insights on time series. Check out possible actions by clicking the three dots icon next to existing networks.
Create a new object with the New Item button on the top right corner.
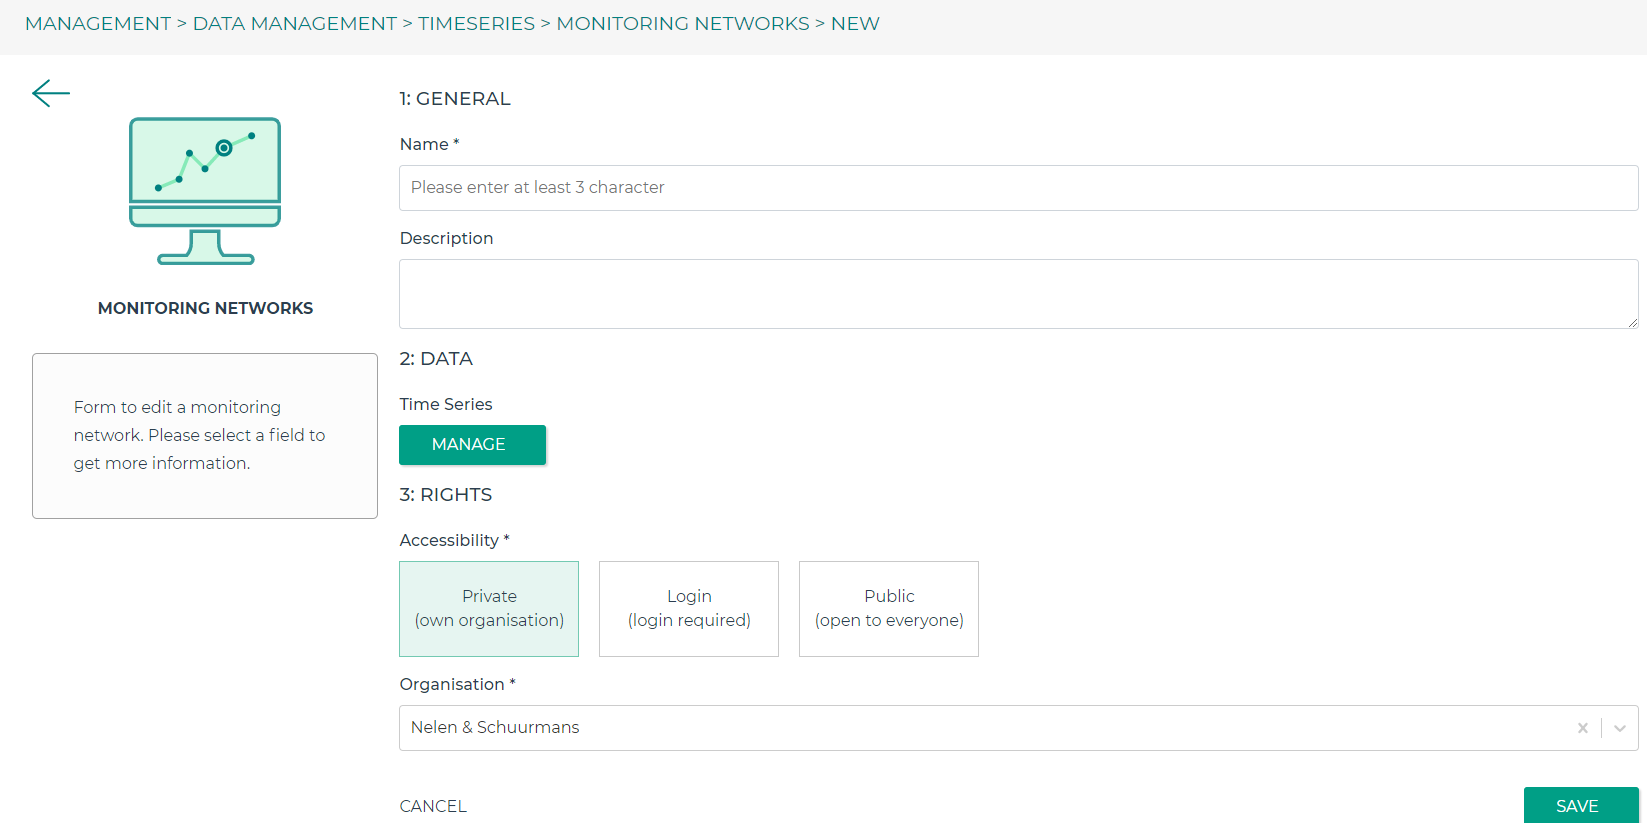
GENERAL
Name (required): Choose a name that is findable and not too difficult
Description (optional)
DATA
Warning
The button “MANAGE” will only work if there are already timseries connected to the monitoring network. If there are, you can remove the the connection here. New connections can be added via the timeseries management app.
RIGHTS
Accessibility (required, private by default): Choose an access modifier to decide who has access to this object.
Organisation (required, pre-filled): The organisation this object belongs to.
If you are satisfied, click “SAVE”
Scenarios
The data management interface for scenarios can be used to manage scenarios.
Search for a scenario
You can search for a scenario by either typing (part of) the scenario name, the UUID, username of the supplier or model name.
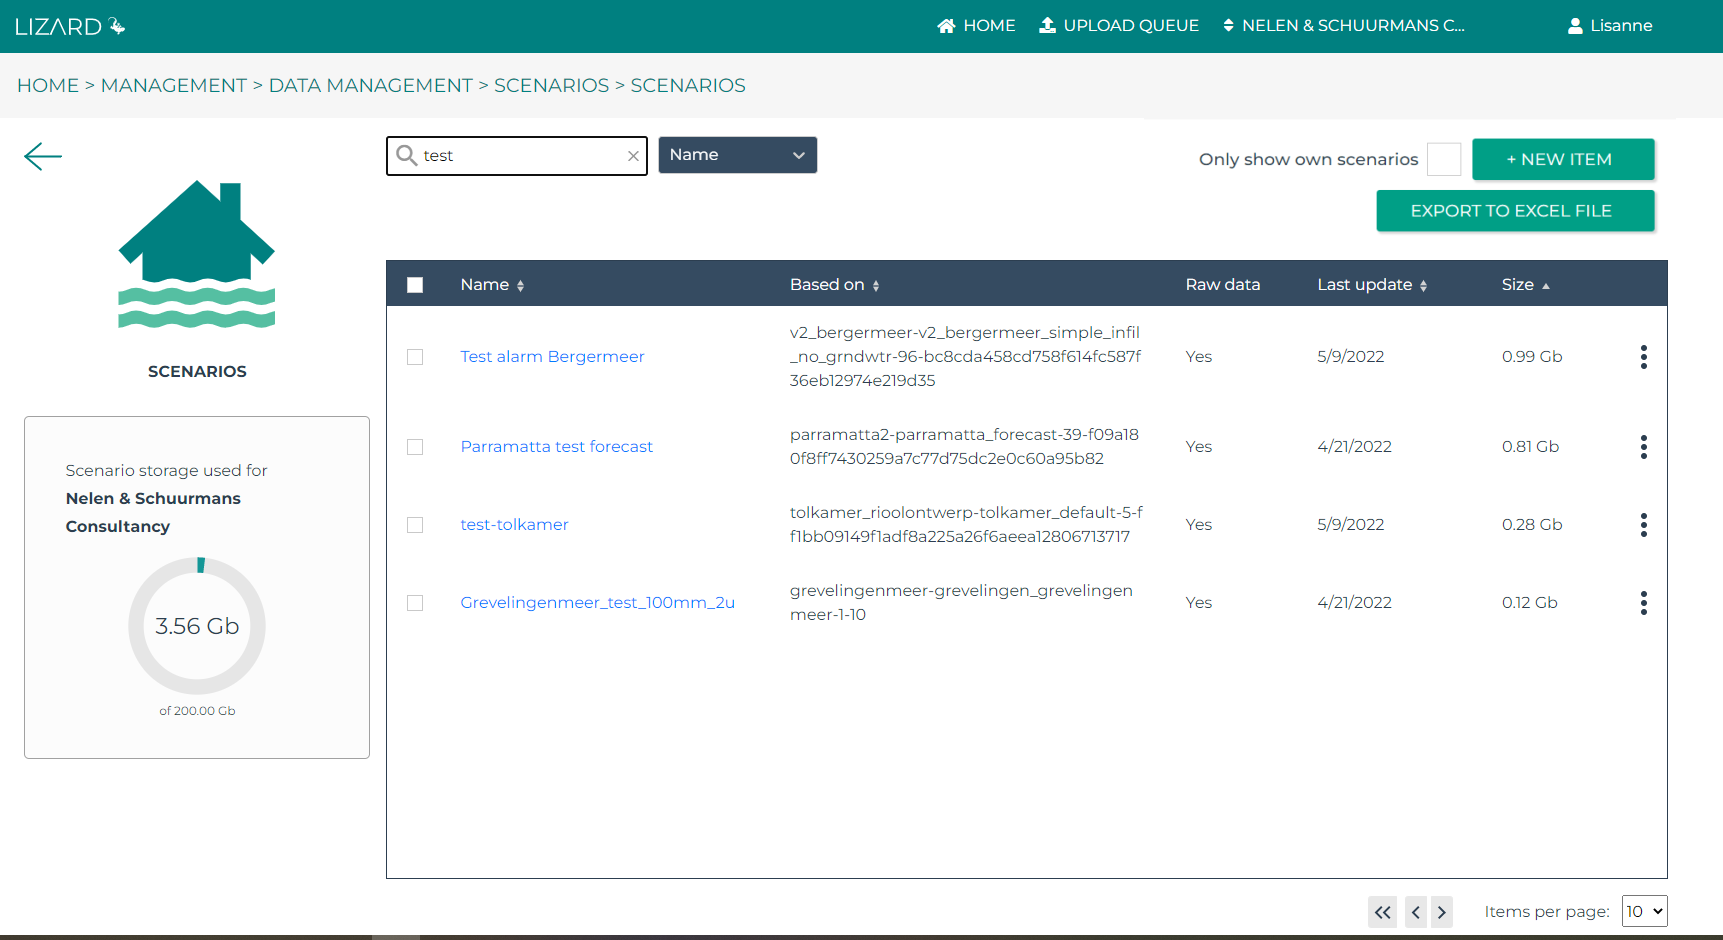
You can also specify that you only want to show your own scenarios by ticking the box in the top right corner. In this same corner you will find the export to Excel button. With this new functionality you are able to get an overview of all scenario’s in your organisation (if you have the proper rights.).
Note
You will only see your own scenario’s if you have User and/or Supplier roles. To be able to view all scenario’s the Administrator or Manager role is required.
Used storage and deletion of scenarios
In the left side, you can see the used storage for your organisation. This may have influence on your subscription.
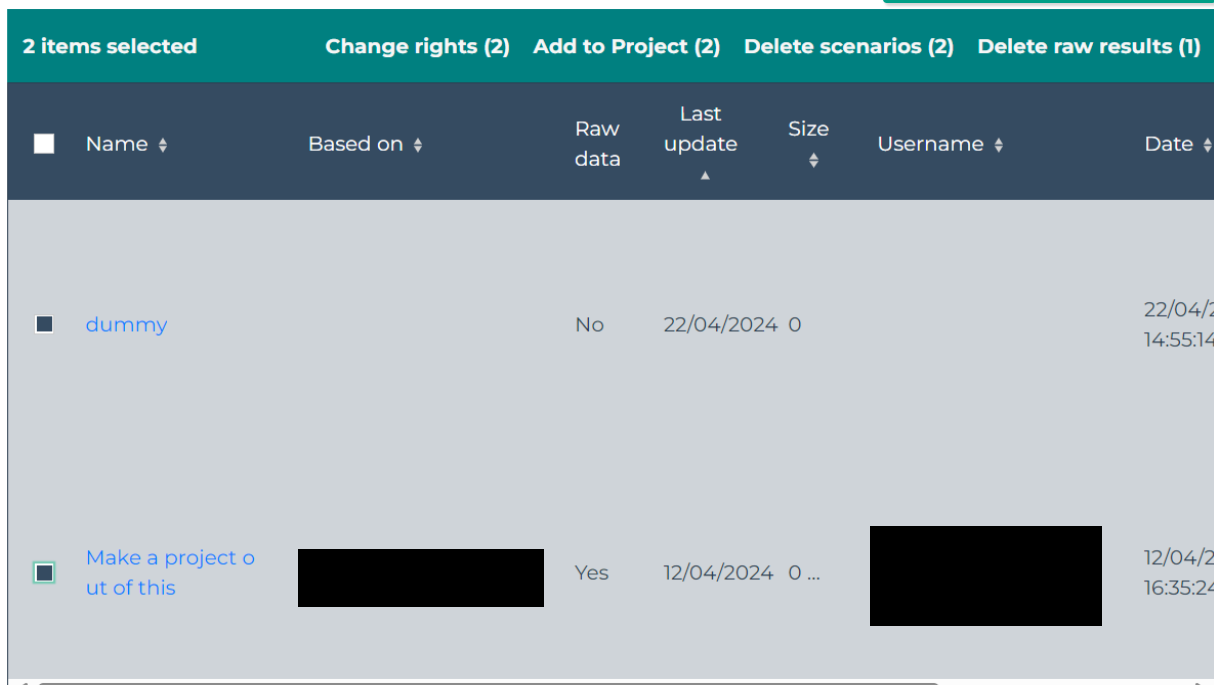
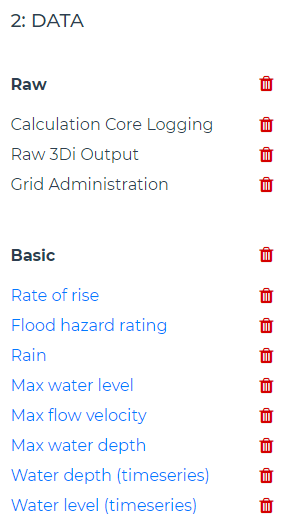
If you want to remove a complete scenario, you simply check the box of the relevant scenario(s) and choose Delete scenarios (nr). If you choose Delete raw results (nr), it will only remove the raw data and not the timeseries and rasters. You can also remove a specific raster of a scenario by double-clicking on a scenario and clicking on the ‘trash’ icon next to the layer.
Before the deletion, you will first be shown a warning. You will be asked to confirm you really want to delete these scenario’s.
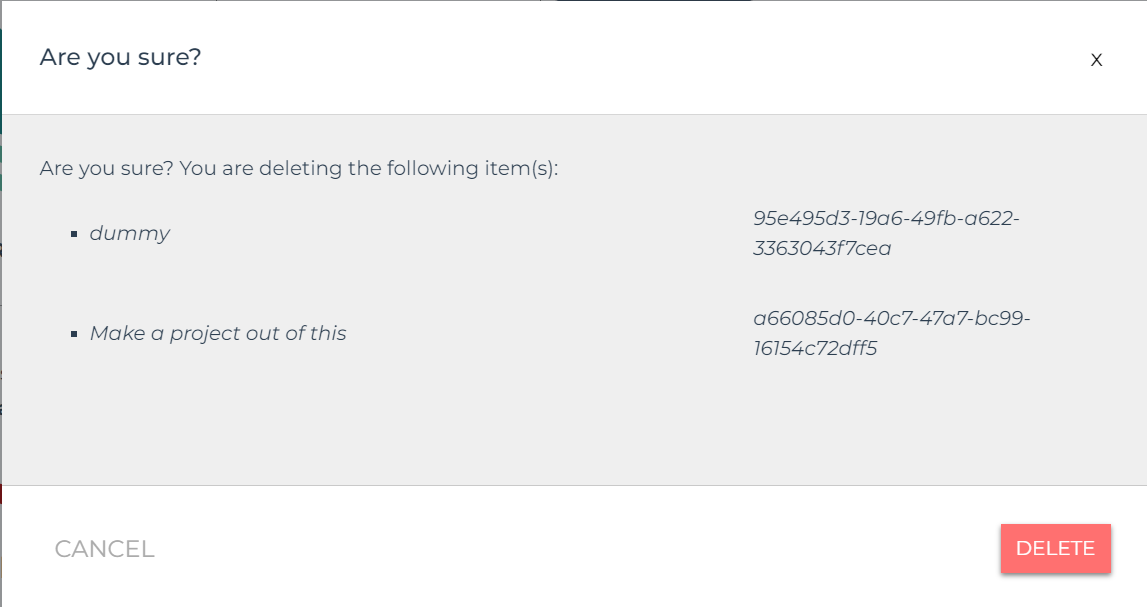
Warning
If you delete a scenario, it is really gone! We might be able to retrieve the rasters if you contact support within 14 days.
Add a scenario
Scenarios can be automatically exported to Lizard, for example via 3Di. You can also add a new scenario with the New Item button on the top right corner.
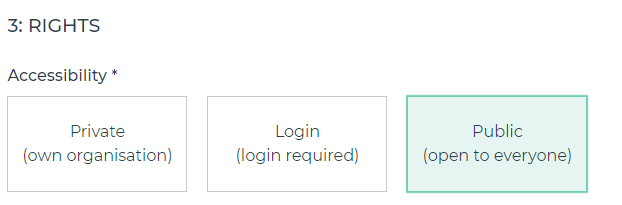
Edit a scenario
Right now you can only edit the accessability of a scenario. Scenarios are private by default (only visible for logged in users of the same organisation). You can choose to make them visible for all logged in users or even public so no login is necessary.
Tip
Make scenarios public if you want to use them in other GIS applications via a wms link.
You can add a scenario to an existing project via the threedot icon.
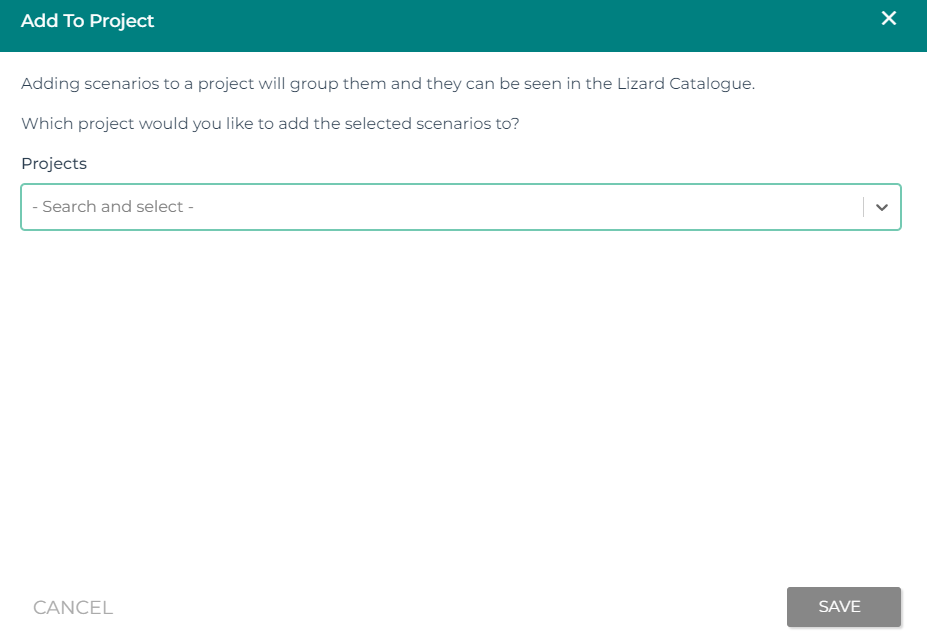
Group scenarios in a project
Projects are used to group and give insights on scenarios.
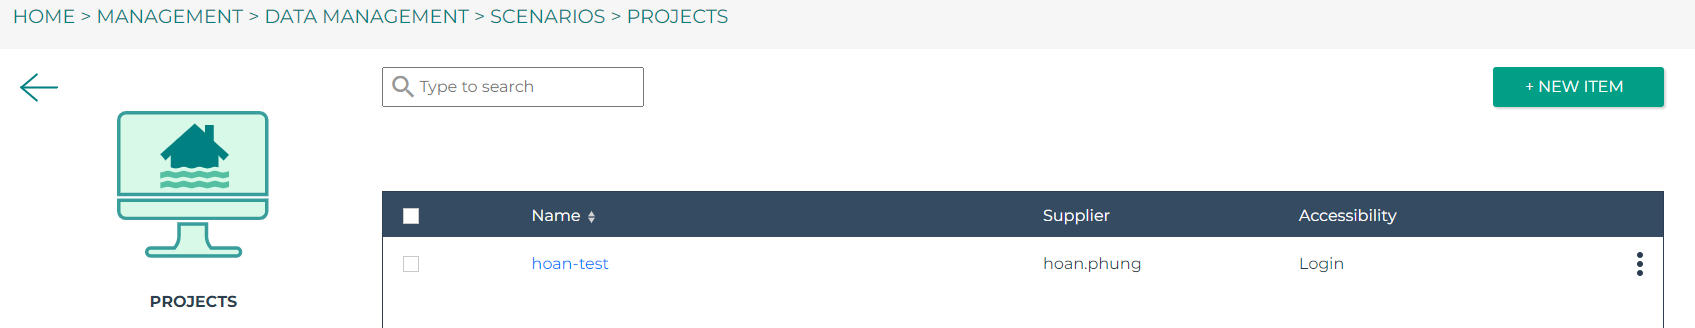
Create a new project with the New Item button on the top right corner.
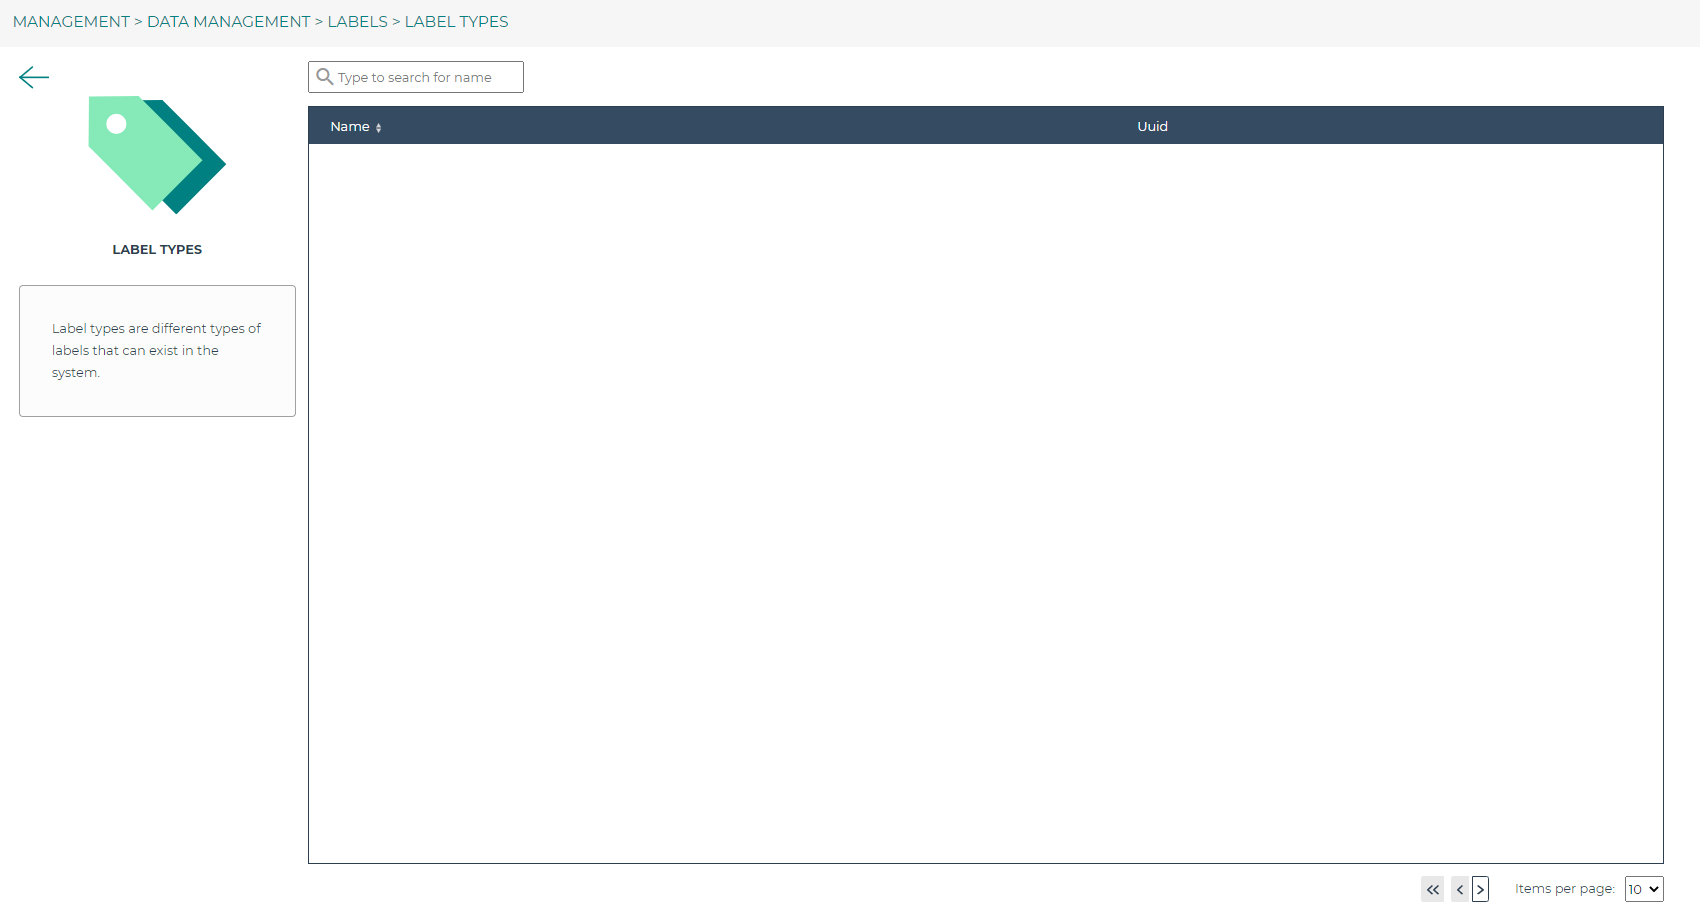
Labels
Warning
This section is to be extended.
Alarms
The Lizard Alarms are a powerful feature designed to provide real-time notifications and alerts based on user-defined criteria. This system enables users to monitor various environmental conditions, ensuring timely responses to critical events.
Notifications
Behind the Notifications tile you find the overviews of existing raster and timeseries alarms for your organisation and their status (active/inactive). The ‘NEW ITEM’ button leads you to the form to register a new alarm. We go through some of the options that the system provides, to explain them in detail.
Selecting a raster
Raster alarms are set on temporal rasters. These can be part of a scenario, a single source raster or a Geoblock. An alarm is set for one point location intersecting this temporal raster.
You can type in the field to search in the names of available rasters. Next, select the type of intersection (Point, Line or Polygon). Draw the geometry on the map or insert a geometry in the JSON field below the map.
For Line and Polygon intersections a spatial aggregation is needed to derive a timeseries that can be compared to the alarm thresholds. The options are:
Sum
Mean
Min
Max
Median
Count
Selecting a timeseries
Timeseries often do not have a clear name or code by themselves. That is why we start with looking up the asset it relates to. Once the asset is selected it should be easy to select the timeseries from the list of related objects.
Relative start and end
The user doesn’t always want to receive alarms for the whole period of newly processed data. For instance, for operational flood models which might have records of prior theshold exceedances, you may only be interested in receiving alarms for forecasted threaths.
To only analyse the relevant part of your data you can set relative start and end. They are set relative to The figure below gives a schematic overview of how this method works.
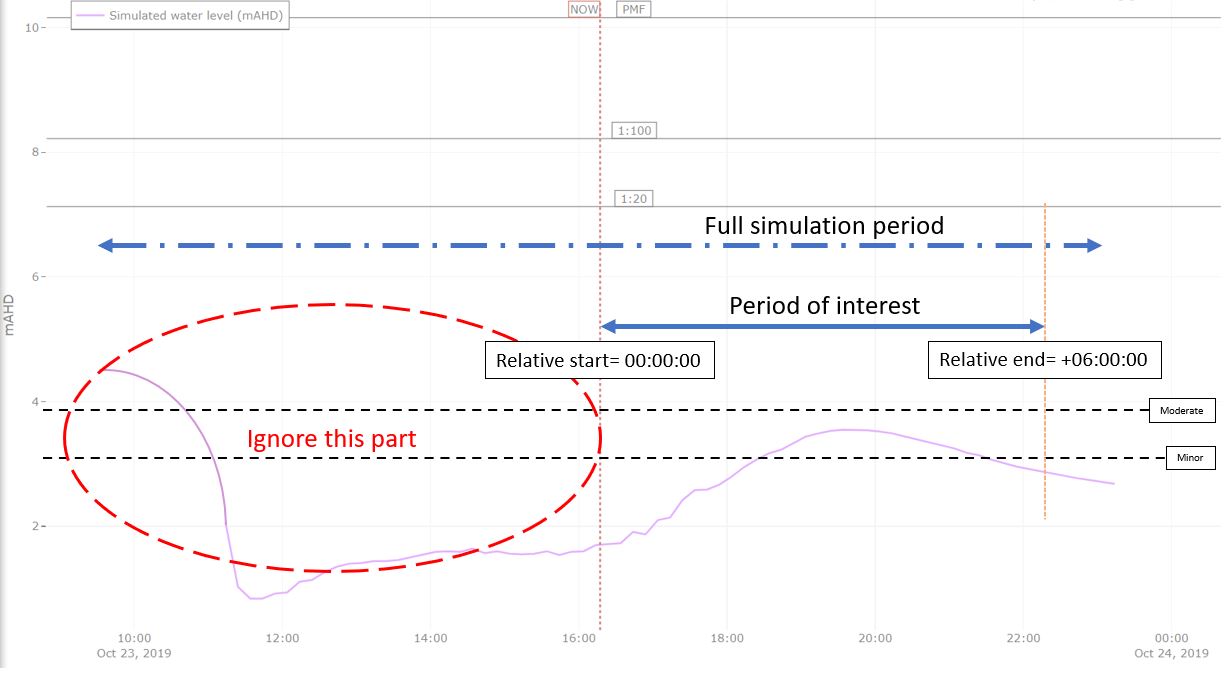
If these fields are left empty the trigger check is done on the complete data frame of newly processed data.
Snoozing option
It can be considered undesirable for alarms to be triggered during brief spikes. The snoozing option allows the user to determine the timeperiod a threshold should be exceeded before the alarm is triggered and a notification is sent. This option is available for both the raising of the alarm and its withdrawal. Default is 1 (trigger at first occurrence).
Contacts and Groups
The recipients of alarm notifications are configured in the Contacts screen, with their phone number and/or email address. Each contact can be part of multiple Groups, which in turn can be used in multiple alarms. So no need to do a whole lot of data duplications of contact info.
Templates
The notification messages are configured with Templates. There is a difference in setting up Email and SMS Templates:
Email: Supports both plain text and HTML and are not limited in length
SMS: Plain text with maximum length of 160 characters (after substitution of variables)
You can use a number of variables to enrich the content of the notifications and make them applicable to different alarms. The variables contain options for including the name of the receiver and details about the alarm at hand.
The option “No further impact” determines that a message is used specifically to notify when an alarm is fully withdrawn. This type of message can be set in addition to a standard message to let receivers know that the situation has settled down. This often requires a different text and therefore a different Template.
User Management
As user management is only of interest to managers, this is discribed in its own section. Find the page on user management here.
Personal API Keys
Personal API keys are used to authenticate external applications with basic authentication. These keys are essential for ensuring secure access to APIs without exposing your username and password. This follows a security measure, labeled as ‘basic authentication’. The interface, allows you to manage your personal API keys. The list of keys is displayed on the right side of the page. You can add new keys by clicking the “+ New Item” button.
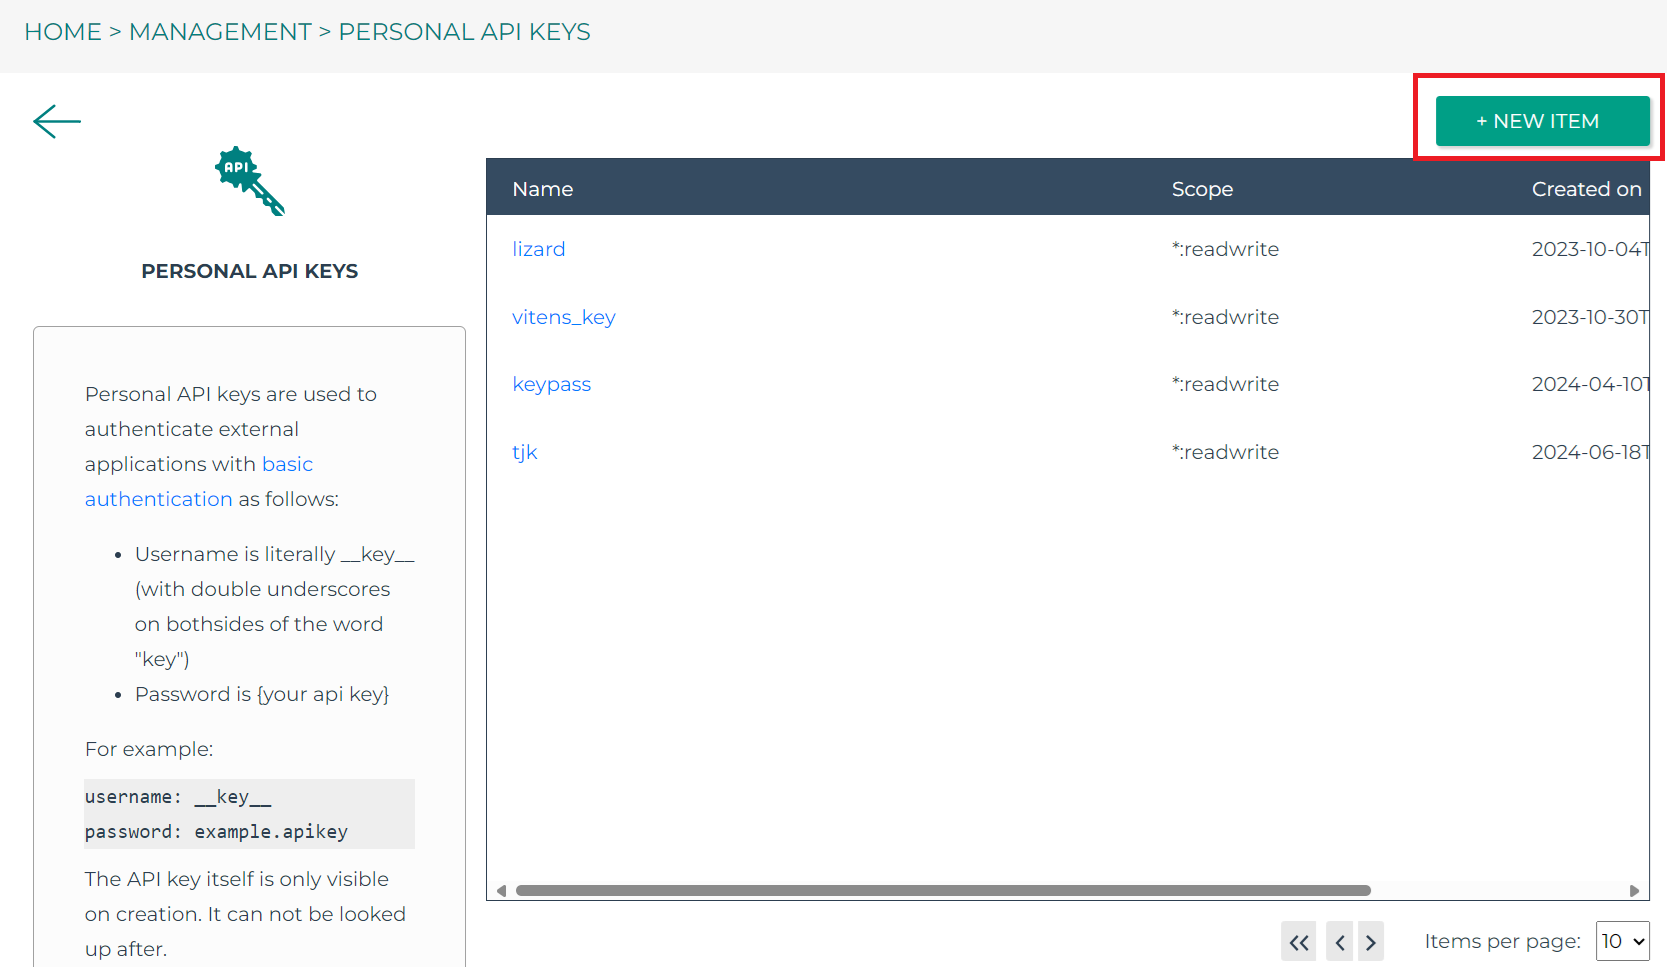
Within the viewport you can find the following information:
Name: The name provided to the API Key, this is mainly for you to remember what you used the API Key for.
Scope: Currently two scopes are available - Read/Write and FTP.
Created on: The date and time of the key creation.
Tip
Visibility: The API key is only shown once at the time of creation. Ensure you save it securely, as it cannot be retrieved later.
Tip
Security: Treat your API key like a password. Do not share it publicly or expose it in your application code. By using personal API keys, you can securely interact with external applications and services, ensuring that your API credentials are kept safe.
Authentication
To authenticate using a personal API key, follow these steps:
Set the authentication type to ‘basic authentication’
Set the username to __key__ (with double underscores on both sides of the word “key”).
The password is your unique API key.