Viewer
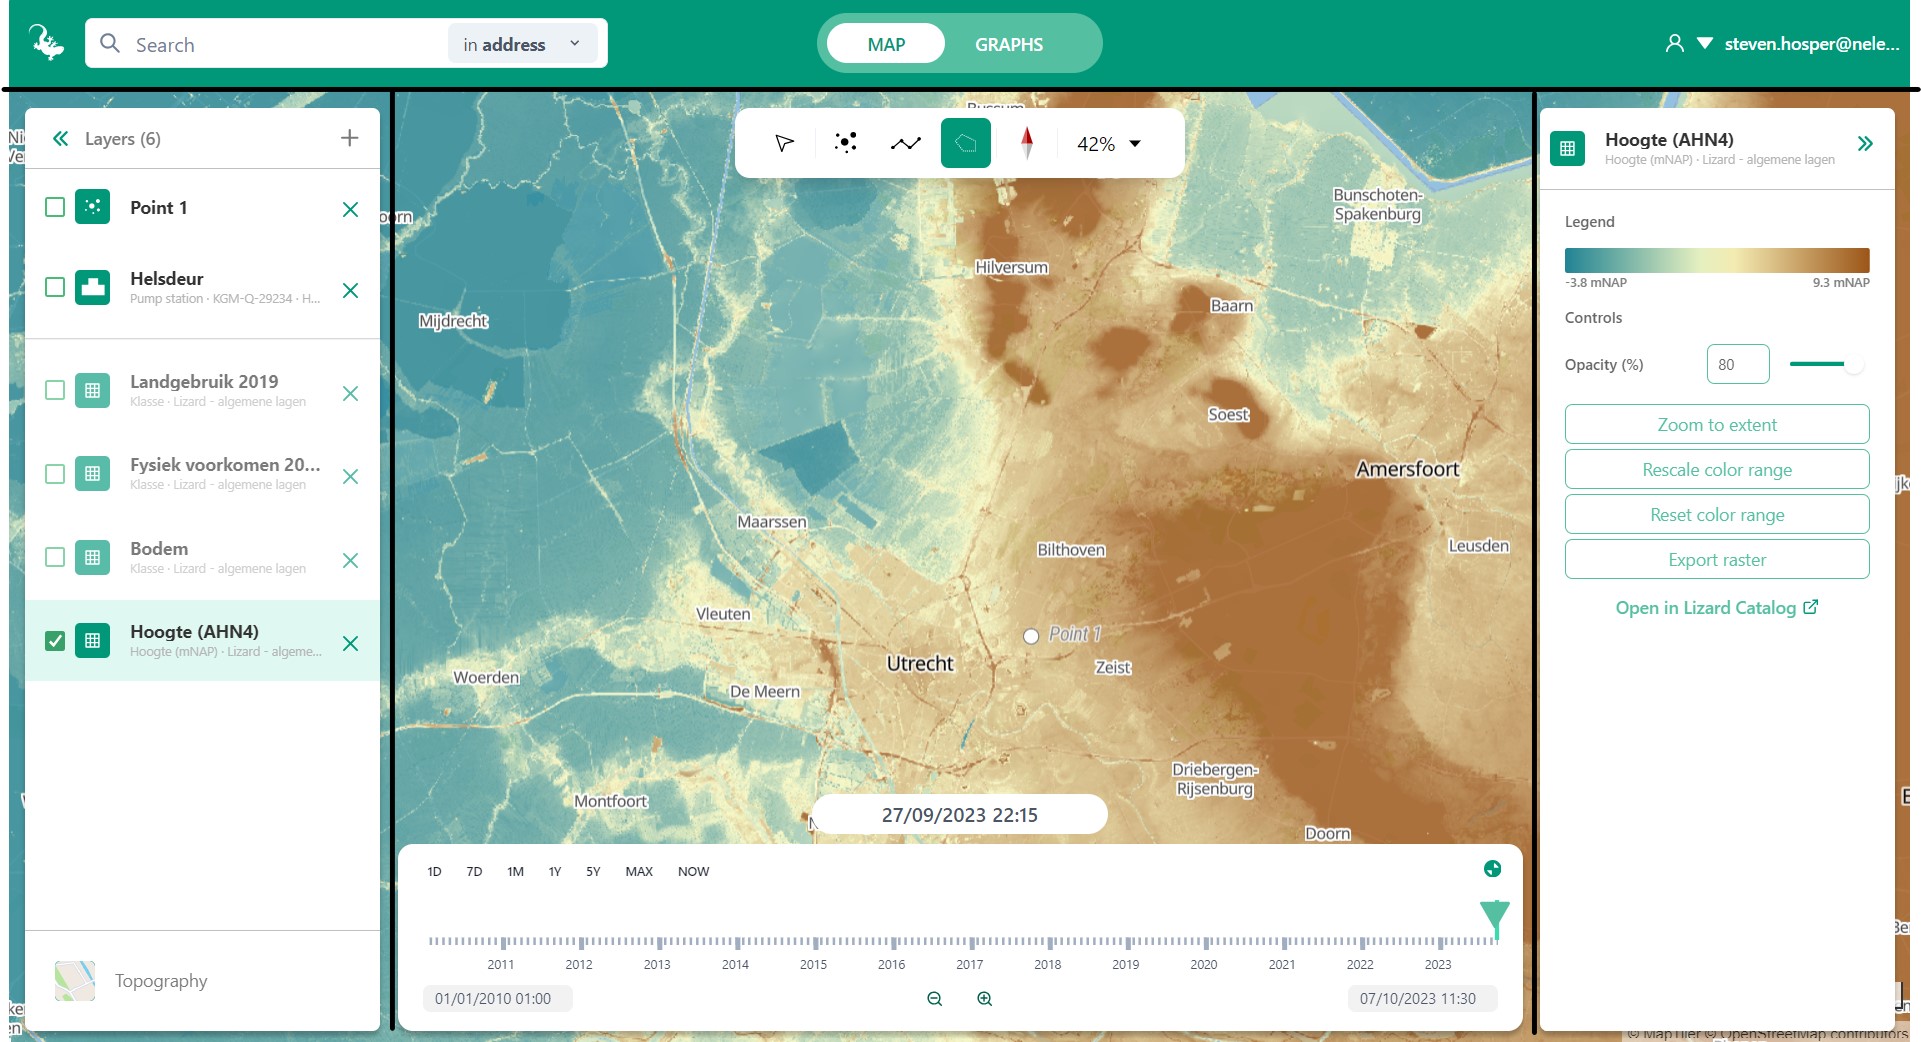
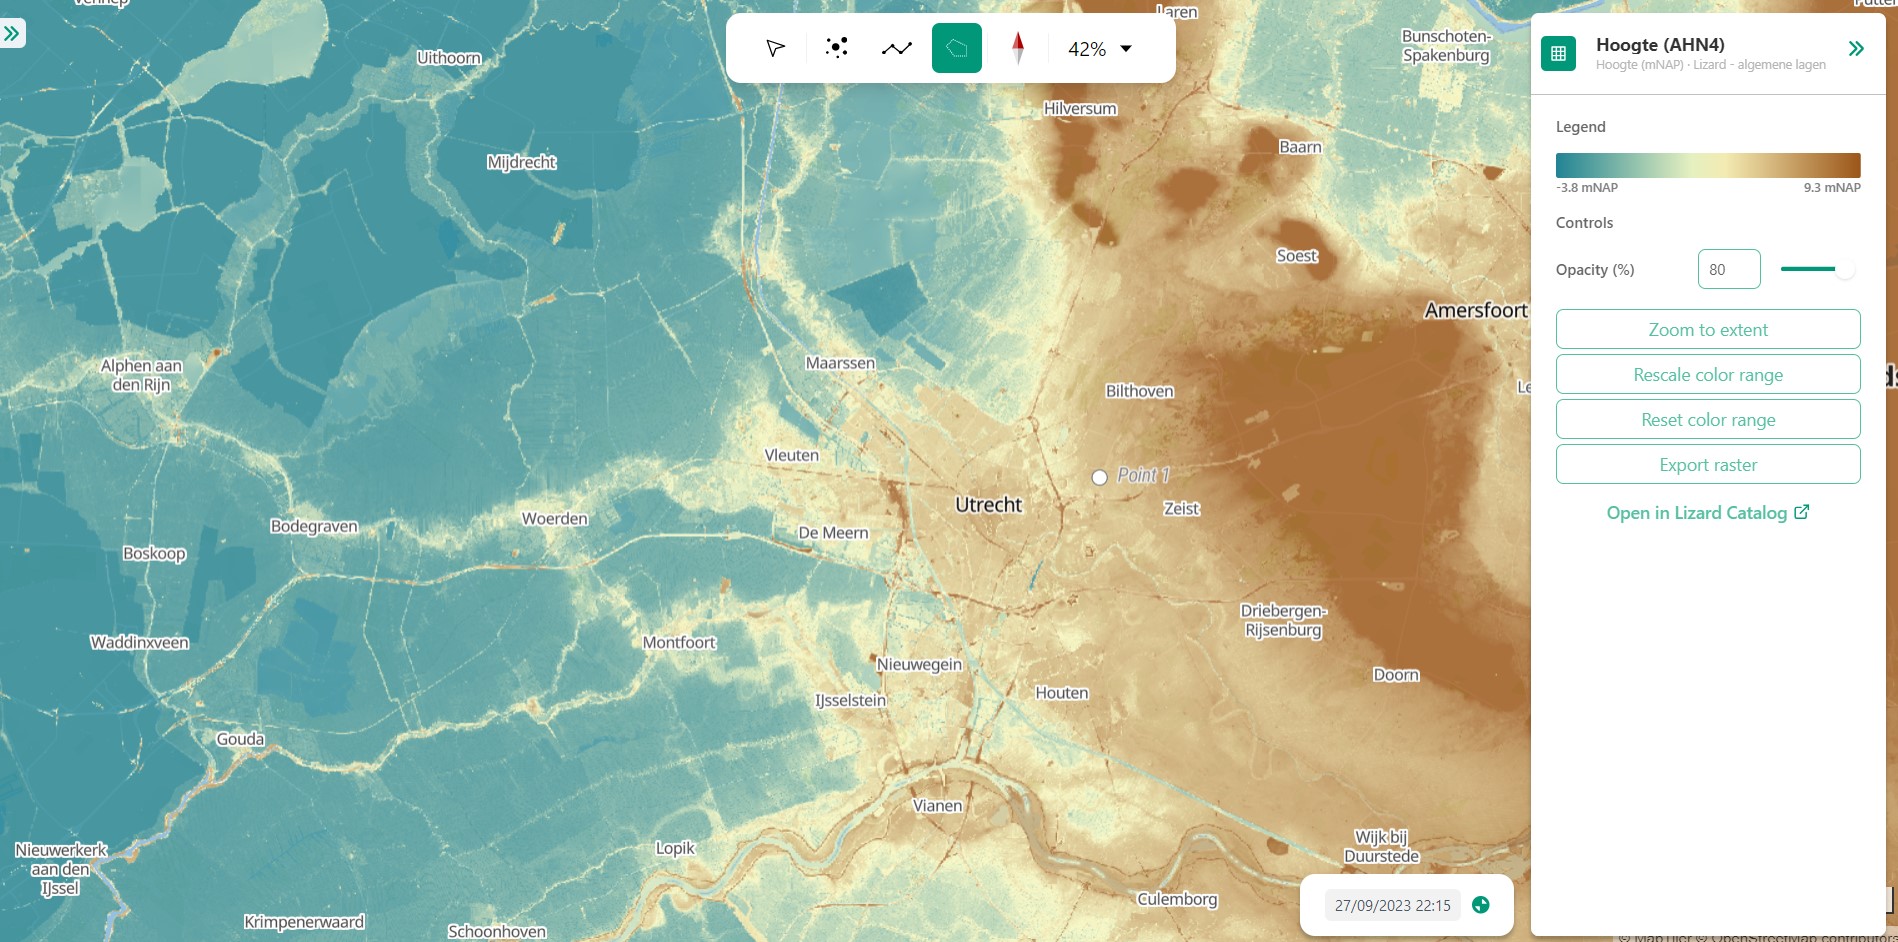
The Lizard Viewer is a graphical user interface (GUI) in which measuring locations, parameters, time series, rasters and other layers are visible. Below you will find an overview of a general Lizard Viewer instance. Every aspect of the viewer will be discussed and in the end we will supply a series of short tutorials designed to kick-start your Lizard experience. These are short and simple explanations of commonly used features that might require a short explanation. If you are struggling with any of the features, feel free to contact the service-desk for guidance.
Elements Overview
The Lizard Viewer can be divided into 4 sections, with each their own elements. We will handle items within a section from left to right, top to bottom:
The Top-bar:
1.1: Lizard Menu
1.2: Search Bar
1.3: Map / Graph
1.4: Settings and Login
The Viewport
2.1: Select Menu
2.1.A: Cursor
2.1.B: Point
2.1.C: Line
2.1.D: Polygon
2.1.E: North-South
2.1.F: Hotkeys
2.2: Time Panel
2.2.A: Datetime
2.2.B: Time Frame Selection
2.2.C: Expand / Collapse
2.2.D: Time-bar
2.2.E: End / Start Date
2.2.F: Zoom Functions
The Left Panel
3.1: Minimize
3.2: Layers button
3.3: Add new x
3.4: Layers, assets and selections overview
3.4.A: Assets and selections
3.4.B: Layers
3.5: Base layer
The Right Panel
4.1: Minimize
4.2: Layer details
4.2.A: Legend
4.2.B: Controls
4.2.C: Export raster
4.2.D: Catalog
4.3: Asset and selection details
4.3.A: General information
4.3.B: Time series data selection
4.3.C: Time series data display
4.3.D: Time series export function
4.3.E: Controls
1. Top-Bar

1.2 Search Bar
At the search bar you can lookup items or locations, depending on the setting used. The right side of the search-bar displays the currently selected option. Clicking results in a drop-down menu with the available search options; currently assets or addresses. A location search will move the viewport to the desired location. The search of an asset will add the asset to the selection panel (left), select the asset and move the screen accordingly.
1.3 Mode change
The mode change buttons allow you to switch between map and graph mode. It should be noted that it is not possible to display graphs if no assets or selections of temporal rasters are provided.
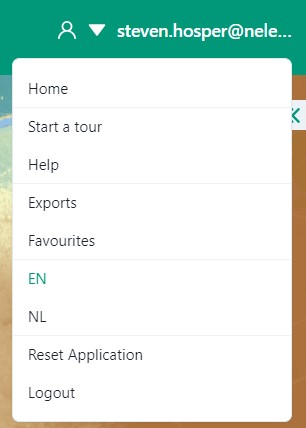
1.4 User menu
Offers a drop-down menu in regards to links, support tools, settings and the login.
There is a link to the homepage available under home, and a link to the documentation at help.
To get familiar with the entire viewer one can use the Start a tour button.
This button will start a ‘tour’, during which the functionality of the viewer is introduced and explained briefly.
The tour has a lot of functionality, allowing you to move forward and backward through the items.
Furthermore, once confident you can skip the rest of the tour or if you would close the tour screen it can be resumed by clicking on the pulsing blue dot.
If the tour is skipped at any point it can be restarted by using the Start a tour button once more.
Clicking Export will take you to the exports overview.
In this overview you can see the status of your exports and download or delete any available exports.
Next up is favourites, which will open the favourites overview screen.
Similar to a bookmark, favourites allows you to save the current view, in both map and graph mode, to be saved.
This includes the view-box, the layers and assets and time frame.
This ‘favourite’ can then be loaded from the menu to quickly re-access the saved view.
By using the option make time relative the user is able to determine if a favourite should remain static, or adjust based on the time past.
We then find two language options: EN for English and NL for Dutch.
Clicking on between the EN and NL buttons will swap the language settings for the entire Lizard Viewer.
Finally we find the Reset Application and Login / Logout buttons.
Reset Application as the name suggests resets the Lizard Viewer.
This can be useful when you want to have a clean slate to work in.
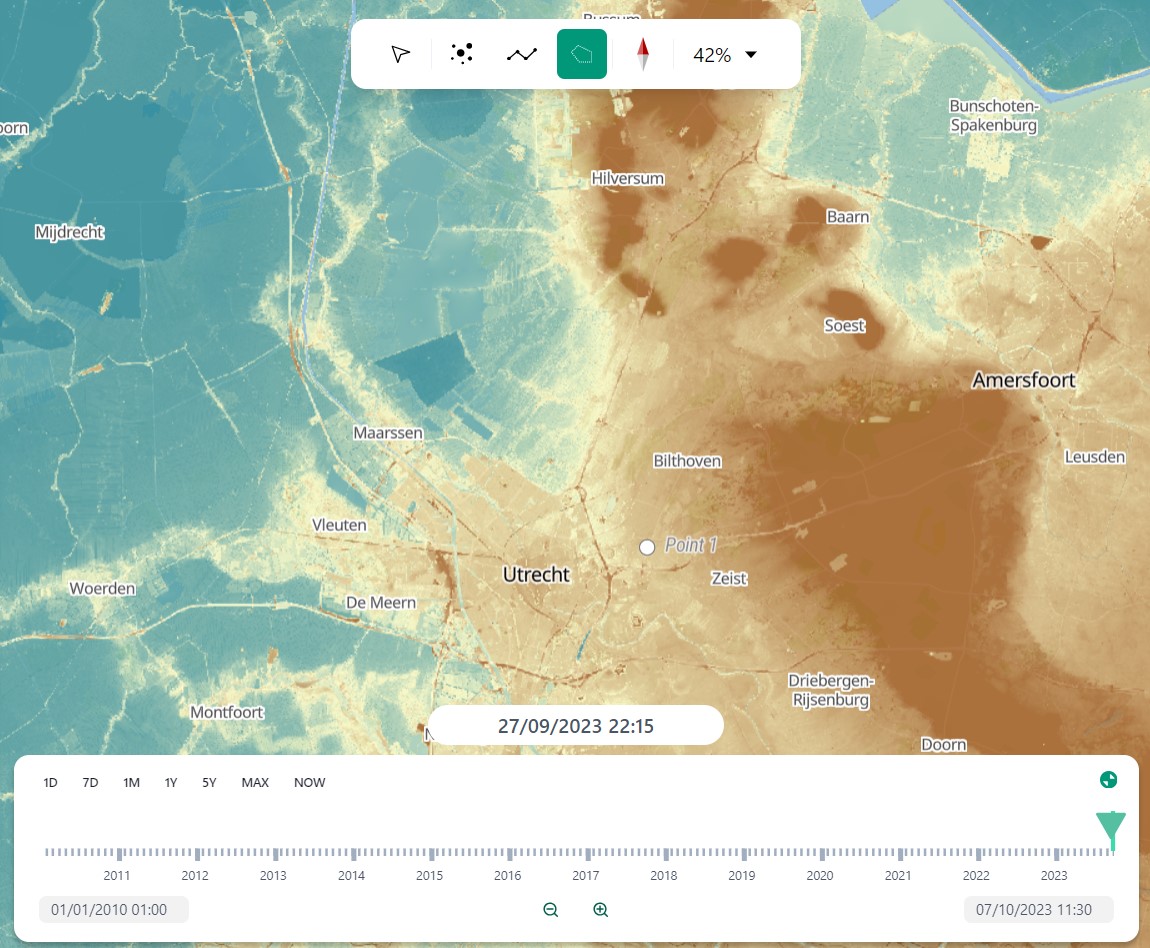
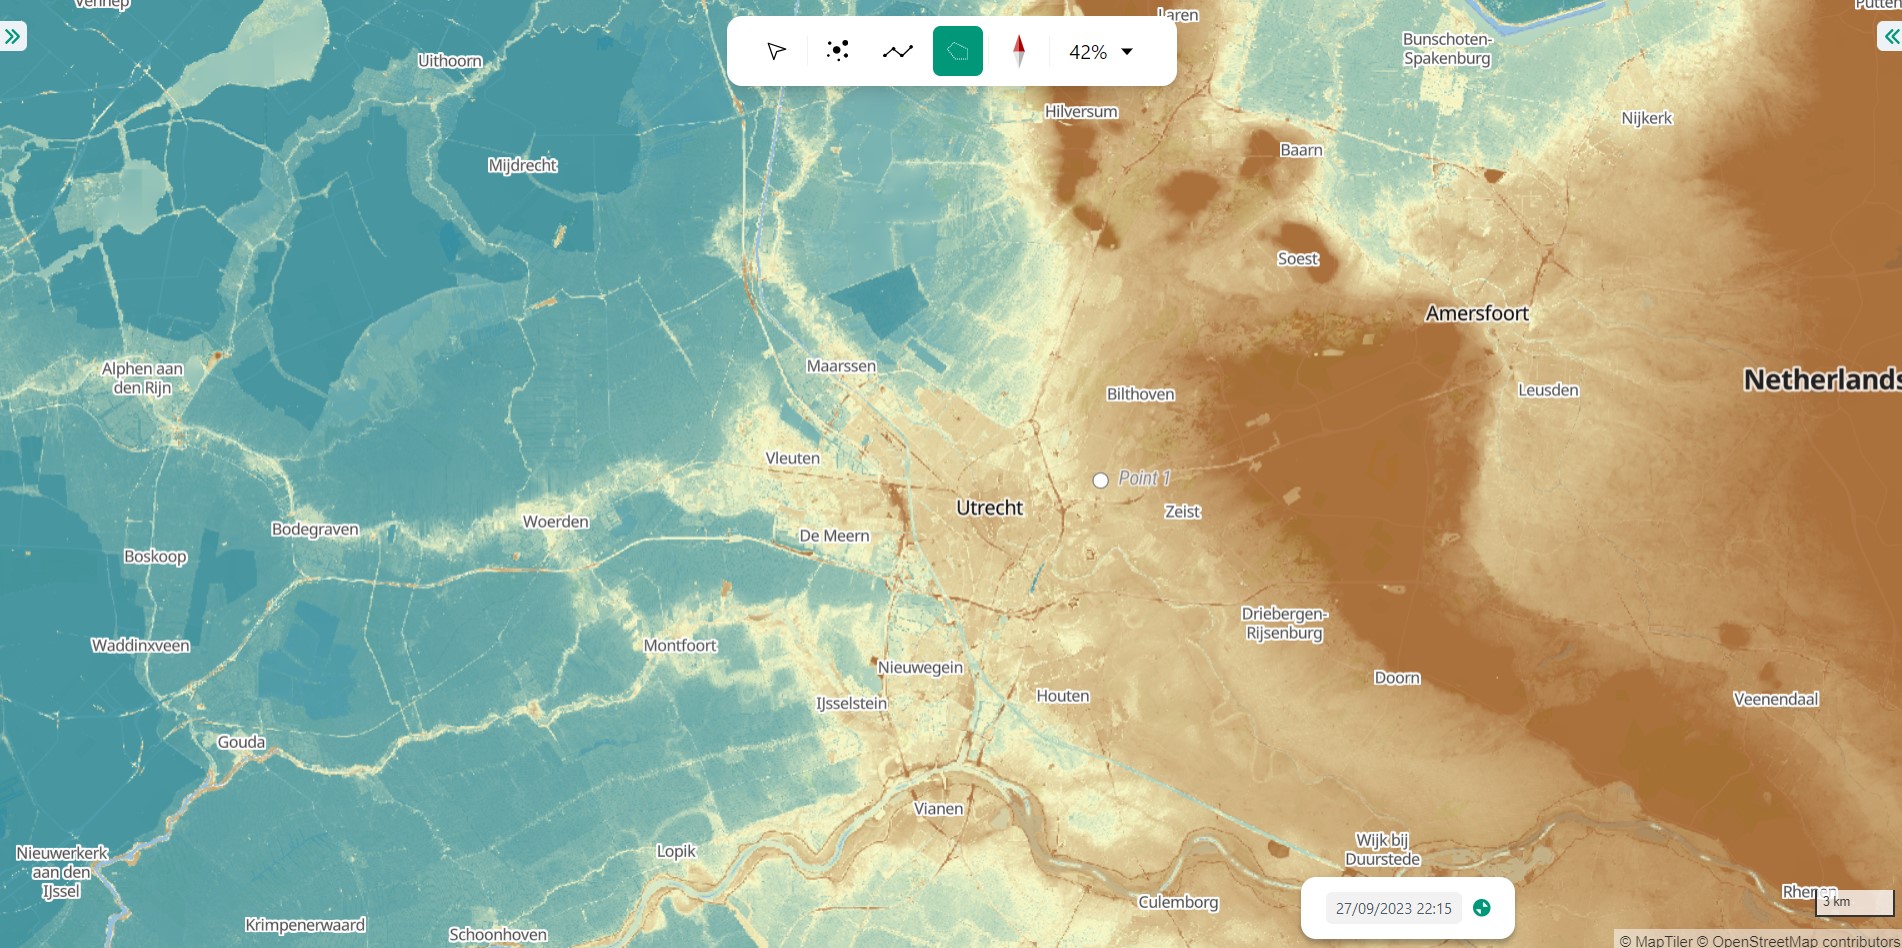
2. Viewport
The viewport is the section of the screen used to view the map and your results. There are two ways to interact with the viewport:
With the selection tool
With the time-bar
2.1 Select Menu
The select menu determines the way you interact with the layers with the cursor and is found at the top of the viewport. There is a variety of options to choose from. At all times you are able to move the view through dragging.
Tip
If you hold CTRL while dragging you turn the angle of the viewport.

2.1.A: Cursor
The Cursor when selected allows you to select individual assets by clicking on them. If you want to select multiple assets, CTRL has to be pressed while clicking.
2.1.B: Points
Allows you to create one or multiple points that display the value of a raster, or the time series for temporal rasters. As a default only one point can be created. This way clutter is avoided. If you are interested in using multiple points you could use CTRL-clicking to add multiple point assets.
2.1.C: Line
Able to create a straight line. If you click once you start the line placement. The second click will complete the line. If instead of selecting a different point, you re-click the start, the line placement will be cancelled. Could be used to examine the slope of a hill or mountain. With CTRL-clicking one can create multiple lines.
2.1.D: Polygon
The polygon method allows the user to create figures with 3 or more corners. By re-clicking on the previously defined corner you cancel it. It allows you to inspect the statistics of a certain area. Like what percentage of the selected area consists of a certain land-use type.
2.1.E: North-South
If you used CTRL+dragging to move the angle of the screen you can use this button to return the view to top-down North.
2.1.F: Hotkeys
There are multiple hotkeys within the drop-down menu. Every shortcut can be accessed by clicking on it, or using the key that is displayed on the right side.
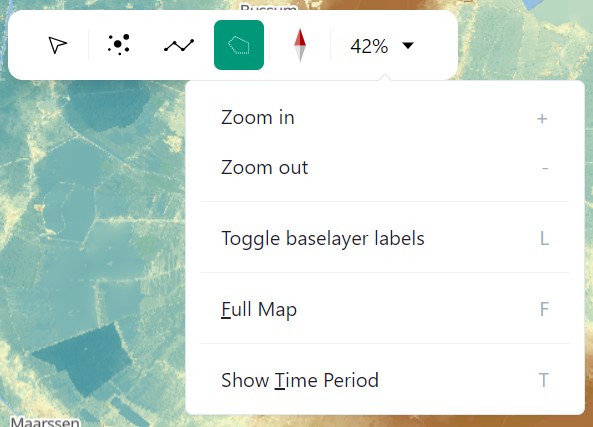
Zoom-in [+]: Zooms in for the viewport
Zoom-out [-]: Zooms out for the viewport
Toggle baselayer labels [L]: Toggles the labels within the baselayer, like names of locations.
Full Map [F]: Toggles the right and left panel to provide a full view of the map.
Show Time Period [T]: Toggles the time-bar in the bottom.
2.2 Time Panel
The time panel is related to all things time. It is located at the bottom of the viewport.
The time panel has a few mentionable items:
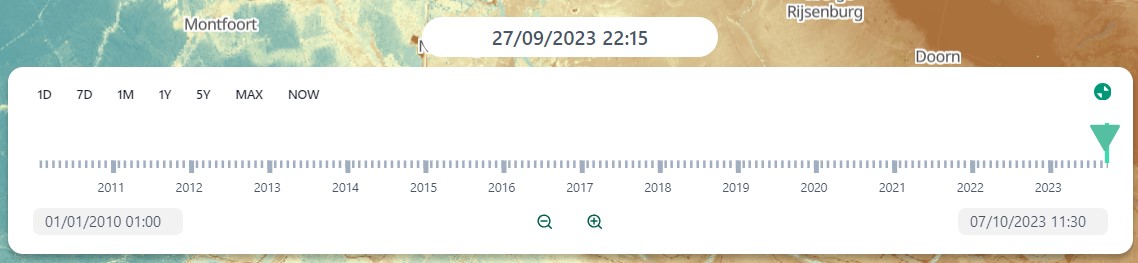
2.2.A: Datetime Display
The datetime display shows you the time frame that is currently viewed on screen.
2.2.B: Time Period Selection
The time period selection tool in the upper-left corner of the panel allows you to select the time period you would like to view in the time-bar.
There are a few standard settings, like one day 1D, a week 7D, a month 1M, a year 1Y or five years 5Y.
These will all show you the time frame between now and the time period.
Thus 1D will for the 27th of September 2023 12:05 will the time from 26/09/2023 12:05 till 27/09/2023 12:05.
The MAX and NOW button function slightly differently.
When one clicks NOW the time-bar centres on the present time, with one day in advance and one day prior forming the time-bar edges.
The MAX button zooms to the time span of the entire data set available.
Note
MAX results in a view of the entire time frame during which data can be found for the selected layers.
2.2.C: Expand / Collapse
The Expand / Collapse button can be found in the top-right corner.
It allows the user to minimize the time panel in two steps:
The first time you use click the button:
The zoom functionality will be removed from the bar together with the time period selection
The time period selection buttons are removed
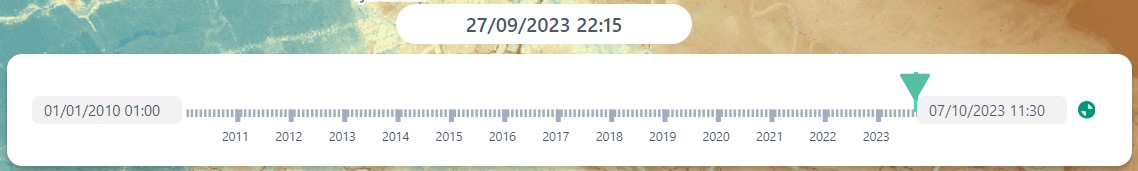
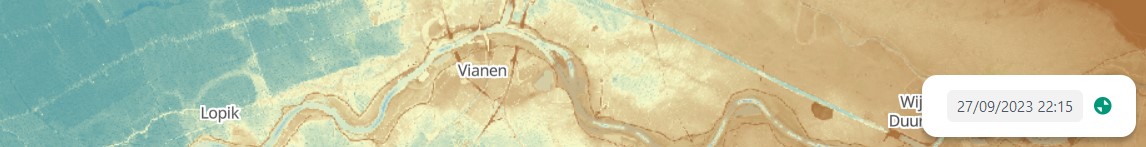
The second button fully minimizes the panel:
The time-bar itself is removed
The start and end dates of the interval have been removed
The datetime date display becomes the current view date and remains visible
2.2.D: Time-bar:: The time-bar displays the time interval of interest. If a layer has been selected, the data from this time period will be displayed in the right panel.
Tip
Support SHIFT-click dragging functionality to zoom into a selection of the time-bar.
Tip
It is also possible to zoom in or out of the temporal time frame with the Scroll button on the mouse.
2.2.E: End / Start Date
At the edges, just below the time-bar, you will find the interval between which the data is displayed in the right panel. For animations, this will be the start and end date. You are able to adjust these dates in a multitude of ways. One is to scroll in the time-bar itself. Dependent on the level of initial zoom the addition or removal of the dates can range from single minutes to multiple years, the build up is gradual.
Another way to update the dates on one side is clicking on the datetime and using the calendar to select a date (and possibly a time).
2.2.F: Zoom Functions
All the way at the bottom within the middle of the time panel you will find the zoom-buttons.
Logically, the magnifying glass with a + icon is the zoom-in, with the - representing the zoom-out functionality.
3. Left Panel
3.1 Minimize
Allows you to move the side panel of the screen so you have complete better of the map itself.
3.3 Add new x
Opens a window that allows you to select a new:
Layer
Asset
Asset set
WMS layer
Scenario
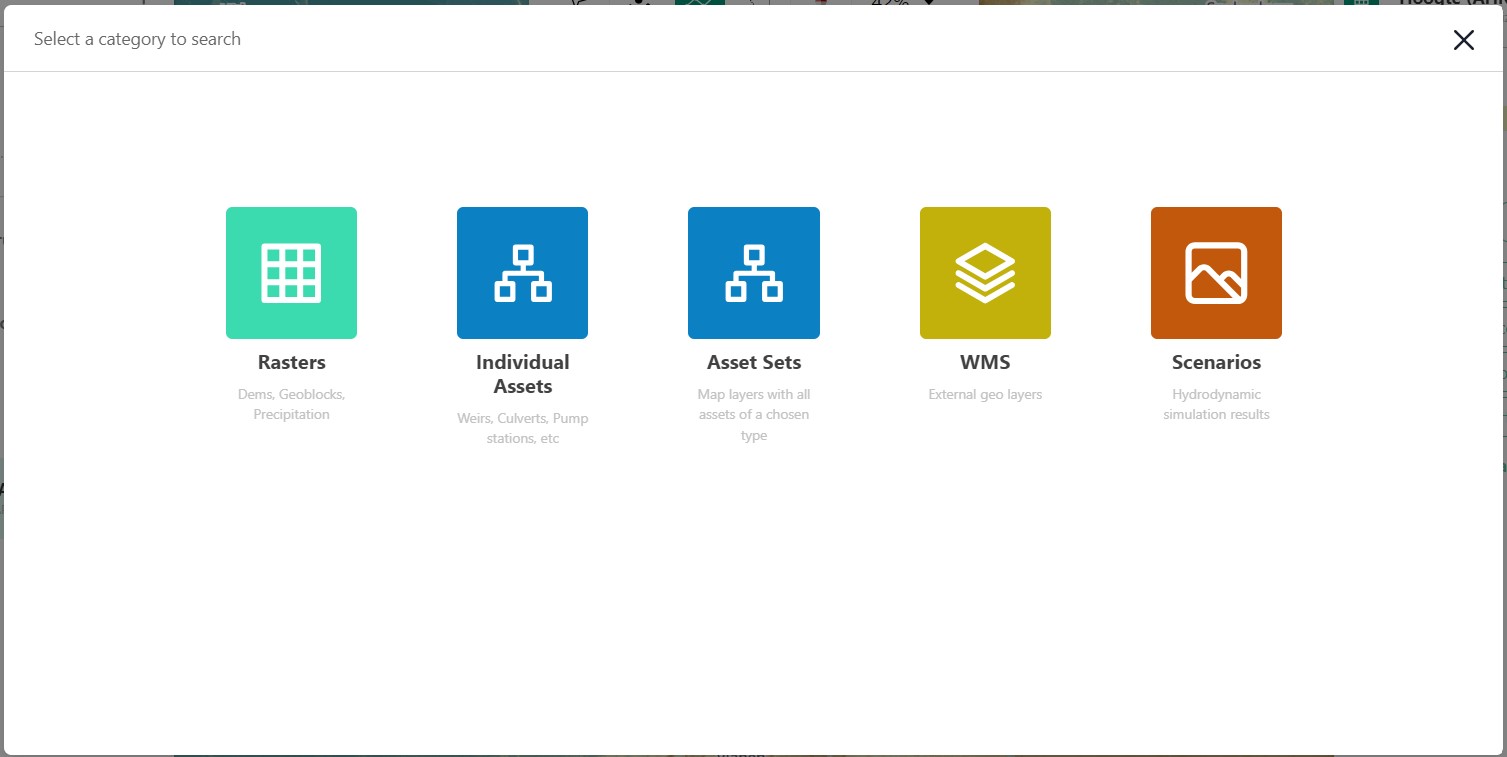
In the menu that opens after clicking the +-icon you are able to select what kind of data category you would like to add to your selection.
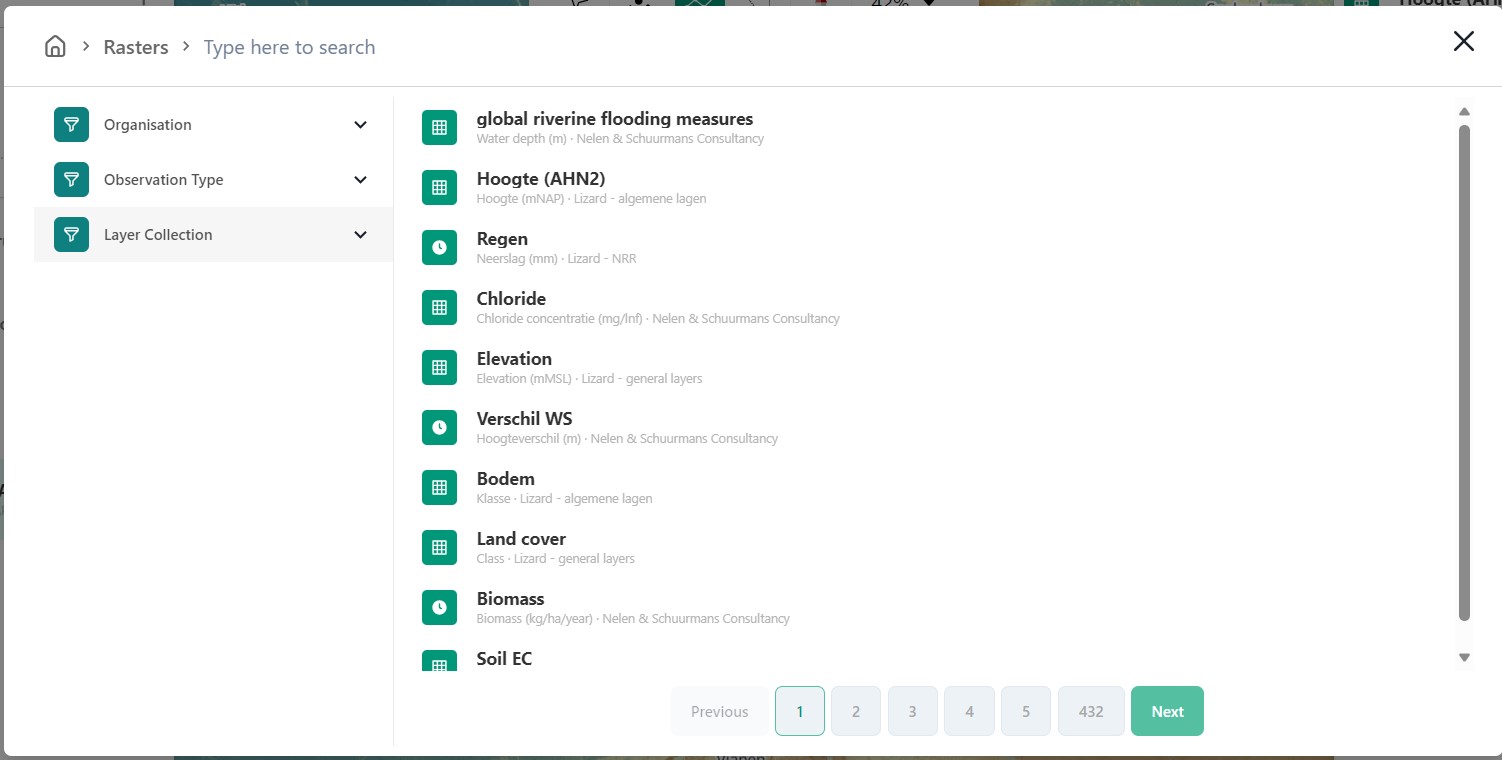
An example of how your screen could look if you wanted to add a layer of the type ‘raster’.
3.3.A: Home
If one would like to switch to a different category the home button in the top left corner can be pressed. This will bring you back to the category selection screen.
3.3.B: Search bar
You can search within any category with the search bar at the topside of the pop-up window. This can be combined with category selections to create a more selective overview.
3.3.C: Filters
Within each of the categories there is a variety of filters to apply. Examples are:
Organisation
Observation type
Layer collection
Asset type
3.3.D: Results
This is the panel where the results of your search query are returned.
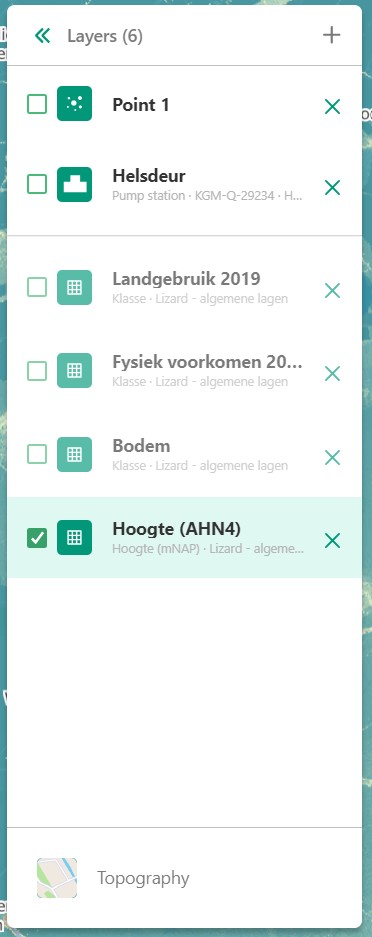
3.4 Layers, assets and selections overview
Allows you to change which layers and/or assets are visible, and their order.
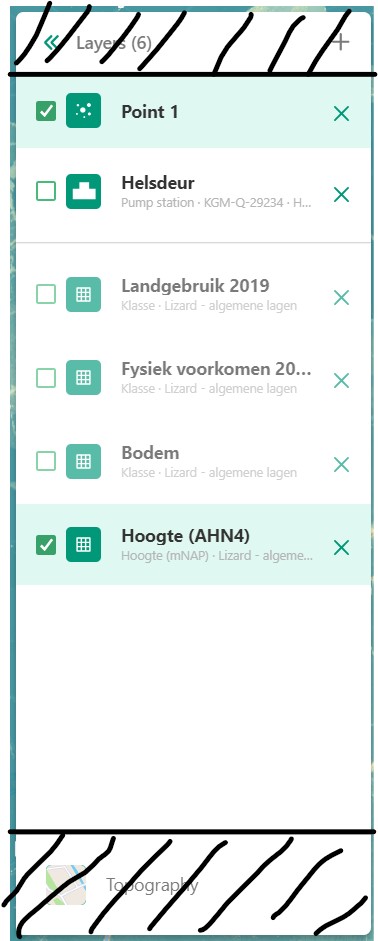
3.4.A: Assets and selections
the top part of the panel is reserved for assets and selections. Often a graph of the data found on a line, point or region can be displayed in a graph. Layers only have legends, separating the two. Because of this additional attribute as a default only one asset or selection will be active. Clicking another asset will de-select the previously selected asset.
Tip
You can select multiple assets with CTRL-clicking.
3.4.B: Layers
Below the gray line layers can be found. Layers comprise of all categories except individual assets or selections. Selecting a layer without the use of CTRL will not result in de-selection of previously selected layers. Selections will interact with the selected layers, allowing you to view time series of temporal rasters, or values found within a region.
3.5 Baselayer
The lowest part of the left panel is related to the base map. By clicking on the layer icon, you are able to alter the base layer. The different layers that are available are:
Topography
Satellite
Neutral
Dark
4. Right Panel
4.1 Minimize
Just like the left panel, the right panel is equipped with a minimize button to give you more access to the map layer. By combining the minimize of the time-bar and both panels you are left with a full map view.
Note
The Full Map shortcut only minimizes both panels, not the time-bar.
4.2 Layer details
Every selected layer is shown in the right panel with additional details visible below.
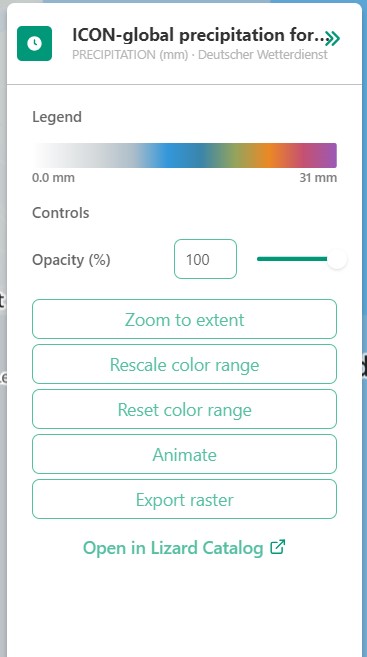
4.2.A: Legend
Displays the raster values. This might be a value scale for scalar data, but it could also possibly be classes for things like land-use.
4.2.B: Controls
Opacity: How translucent is the layer. Can be set anywhere from 0 to 100 percent.
Zoom to extent: Allows the user to zoom to the full extent of the layer.
Rescale color range: Depending on extent of the view the color scale can be adjusted. An example for when this would be very useful would be when zooming in of a height map, adjusting the scale will give you a much better view.
Animate: Animates temporal rasters for you to view the change through time.
4.2.C: Export raster
Opens the raster export view pane. There is quite a lot to this view, an overview is available below.
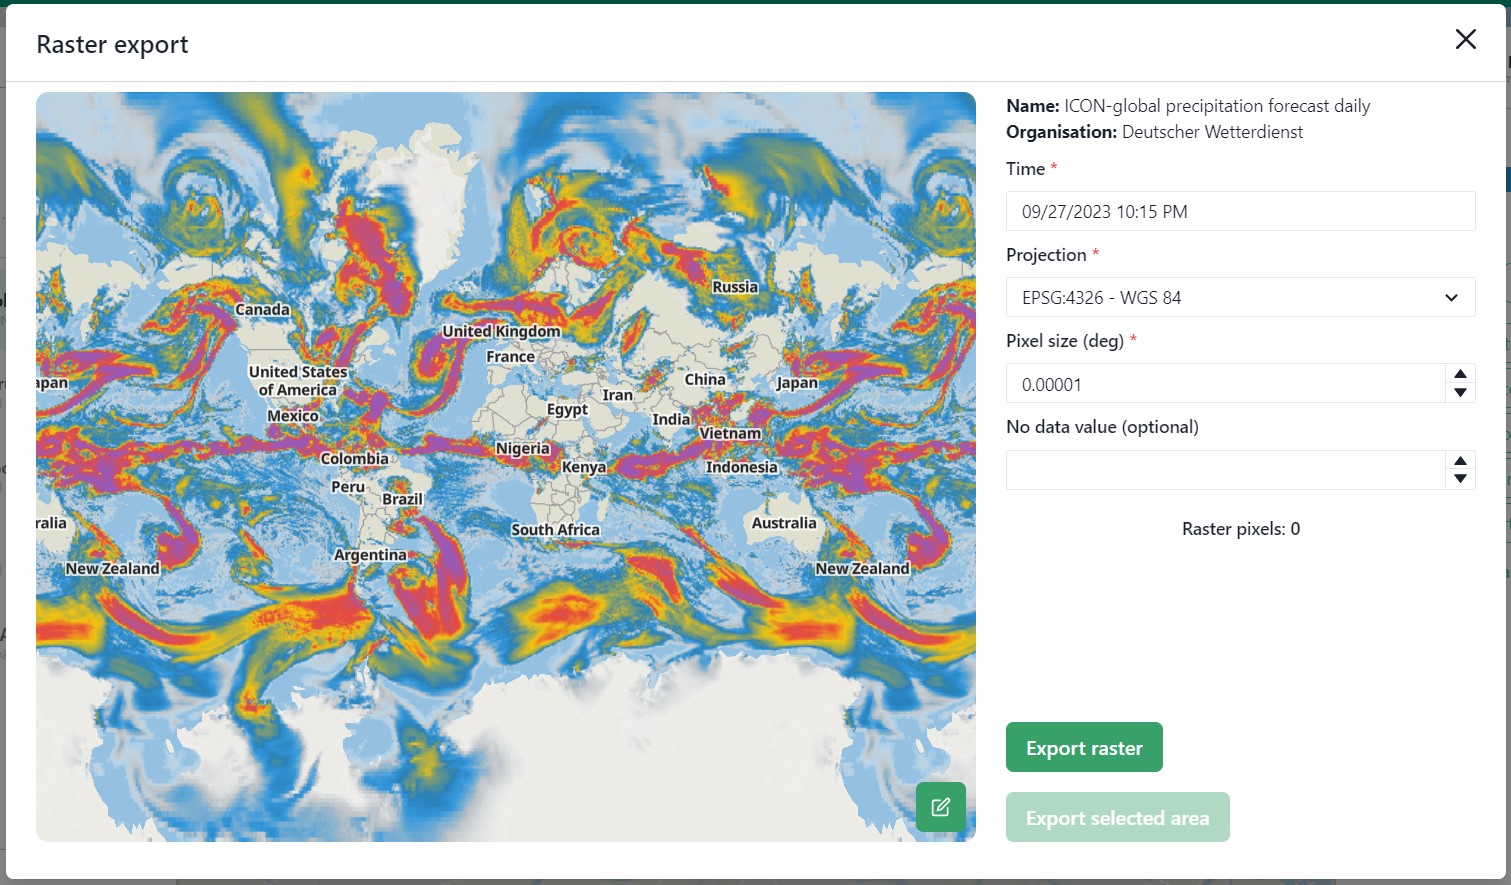
In the export view you will find information about:
Layer name
Organisation name
Projection
Pixel size
No data value (optional)
While the layer and organisation are always set in stone (depending on which layer you decide to export), the other settings are changeable.
The projection determines the unit for the pixel size, with some having degrees as a unit and others having meters.
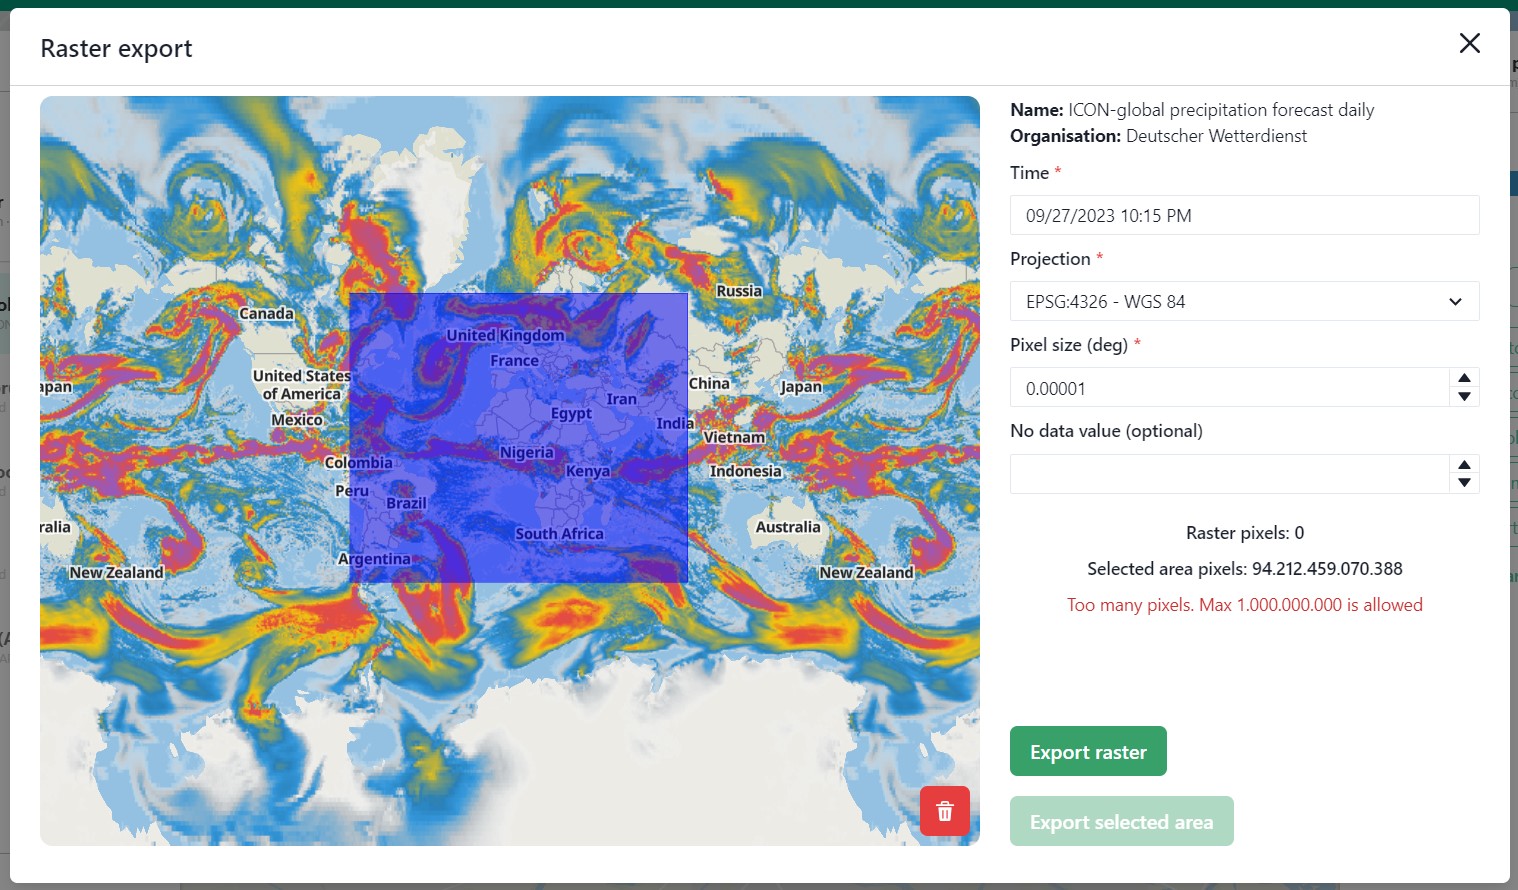
You have the options to either export the full raster, or to make a selection with the draw rectangle tool in the bottom right corner.
If you select a region, but are unhappy, you are able to click the red bin icon to remove the selection.
There is a limited amount of pixels you are able to export, this is to limit the size of the returned file and the time it takes to download the file.
The cap is at 10.000.000.000 pixels.
4.2.D: Catalog
The Open in Lizard Catalog brings you to the lizard catalog, allowing you to see aspects of the raster layer unavailable in the viewer.
It also allows the user to quickly access the API of the respective layer.
4.3 Assets and selection details
Every asset or selection shows its details in the right panel, they stack on top of the layer details.
Note
The order of the assets and layers in the left panel determines the order within the right panel.
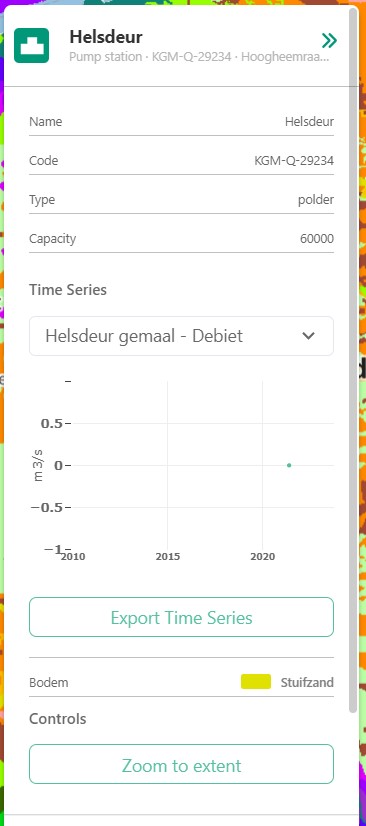
4.3.A: General information
Immediately under the asset general information is available, some examples:
Assets: name, code, type, capacity, station type
Selections: label, coordinates, length or area.
Next to the general information there is also information in relation to the raster layers selected. If a height raster would be selected (or any other continuous value raster) a point would return the value of the pixel, a line provides a graph of the value across the line and a polygon returns a distribution curve. For a raster with categories like soil types a point returns the category found underneath the point, a line returns nothing and a polygon returns a pie-chart with percentages every category has within the polygon.
Tip
Hover over classes within a pie-chart to see more information
The information depends on the asset or selection type.
4.3.B: Time series data selection
Right below the time series label a drop-down menu is available. Within the drop-down field you will find all the data available for the asset.
4.3.C: Time series data display
A graph displaying the selected data type for the time interval displayed on the time-bar. There are many ways to interact with the time frame of the graph:
Click-dragging in the graph itself, this will zoom in to the time range selected.
Interacting with the time-bar through any of the methods discussed in section 2.2
4.3.D: Time series export function
The Export time series button exports all information in the time series for the selected time period (within the time-bar).
The export can be found in the user drop-down menu in the top-right corner.
The time series is given in an Excel file.
4.3.E: Controls
In the controls section we have options that have been discussed prior like:
Opacity: How translucent is the layer. Can be set anywhere from 0 to 100 percent.
Zoom to extent: Allows the user to zoom to the extent of the selection or asset.
Next up we will discuss the dashboards available within Lizard!